...
- Start by dragging out AM|Charts from the components menu
- Resize it to the desired size
- Drag out another component nearby (in the example we are using a button)
- Select the AM|Chart and the other component and right click, and create group
- Delete the other component, so it is just the AM|Chart in the group
- Add a tag on the group (this will be used for the program)
Program
- Go to programs in the left menu
- Click the plus to add a new program, and it will pull up the program editor
- In the Program Target Filter type the name of the tag applied to the group
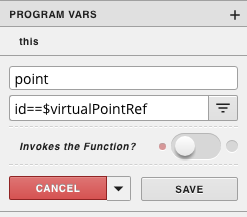
- Click the three dots in the top right corner, and select variables
- Click the + icon to add a new variable
- Click the gear that appears as you hover over the new variable
- On the first line type in point, and on the second line put id==$virtualPointRef
- Click the gray Save button
- Copy and paste the code below into the main section and click the blue save
| Code Block |
|---|
finstack.eval(point.query, function(data){
queryData=data.result.toObj();
var chart = AmCharts.makeChart(Chart.view, {
"type": "serial",
"theme": "light",
"dataProvider": queryData,
  "category": "navName",
  "value": "curVal",
"graphs": [ {
    "balloonText": "[[navName]]: <b>[[curVal]][[unit]]</b>",
    "fillAlphas": 0.8,
    "lineAlpha": 0.2,
    "type": "column",
    "valueField": "curVal"
  } ],
   "categoryField": "navName",
   "depth3D": 20,
   "angle": 30,
   "rotate": "true",
   "categoryAxis": {
   "gridPosition": "start",
   "fillAlpha": 0.05,
   "position": "left",
  },
   "export": {
   "enabled": true
  }
} );
}); |
...