How To Create Your Own
- Start by dragging out AM|Charts from the left side components menu
- Resize it to the desired size
- Next add another component (in this example we used a button) and place it in the world
- Select everything, and right click and choose create group
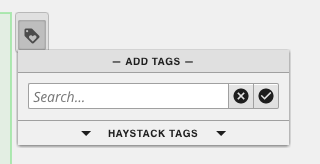
- From here you can add a tag on your group (must add a tag to work with program, ex. columnChart)
- In the left menu, open up the layers, and select the other component (Not the AM|Chart), and delete it (minus icon at the bottom left of the panel)
- On the left side open the programs menu
- Click the + icon at the bottom left to add a new program
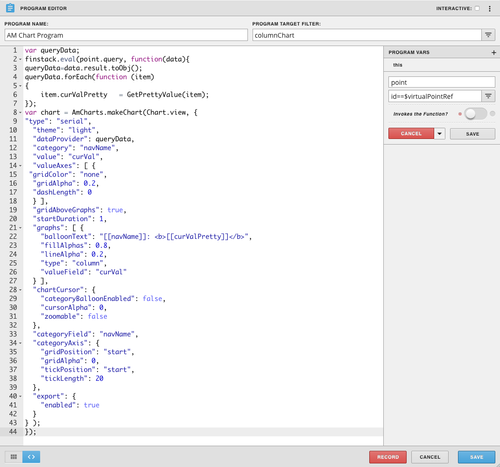
- Name your program under Program Name, and put the tag added to the group under Program Target Filter
- At the top right click the three dots and select variables
- Click the + icon next to Program Vars
- Click the gear that appears as you hover over newVariable
- Change the name of the variable to point on the top line
- On the second line, put id==$virtualPointRef
- Click the gray save button
- In the main section copy and paste the code below and click the blue save
| Code Block |
|---|
var queryData;
finstack.eval(point.query, function(data){
queryData=data.result.toObj();
queryData.forEach(function (item)
{
item.curValPretty = GetPrettyValue(item);
});
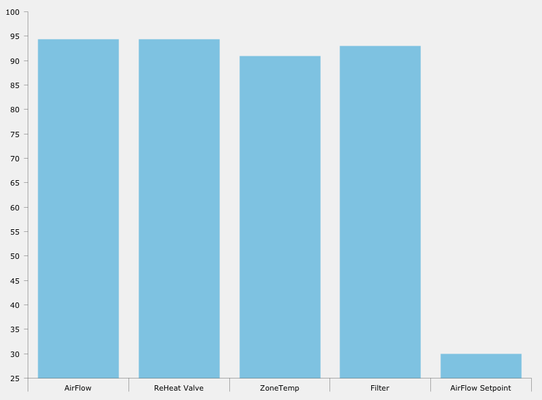
var chart = AmCharts.makeChart(Chart.view, {
"type": "serial",
"theme": "light",
"dataProvider": queryData,
"category": "navName",
"value": "curVal",
"valueAxes": [ {
"gridColor": "none",
"gridAlpha": 0.2,
"dashLength": 0
} ],
"gridAboveGraphs": true,
"startDuration": 1,
"graphs": [ {
"balloonText": "[[navName]]: <b>[[curValPretty]]</b>",
"fillAlphas": 0.8,
"lineAlpha": 0.2,
"type": "column",
"valueField": "curVal"
} ],
"chartCursor": {
"categoryBalloonEnabled": false,
"cursorAlpha": 0,
"zoomable": false
},
"categoryField": "navName",
"categoryAxis": {
"gridPosition": "start",
"gridAlpha": 0,
"tickPosition": "start",
"tickLength": 20
},
"export": {
"enabled": true
}
} );
}); |
- With the group selected go to the properties panel
- Under Advanced, add a new tag, by clicking on the + icon at the bottom left
- Name the NewProperty query
- Then name the NewValue to be set to the query desired (In the example we use readAll(point).get(0..3)
Using the Chart with Ractive
Start by dragging an AM Chart into the workspace. Next right click and select show/hide so that you will no longer be able to see it
...