How To Create Your Own
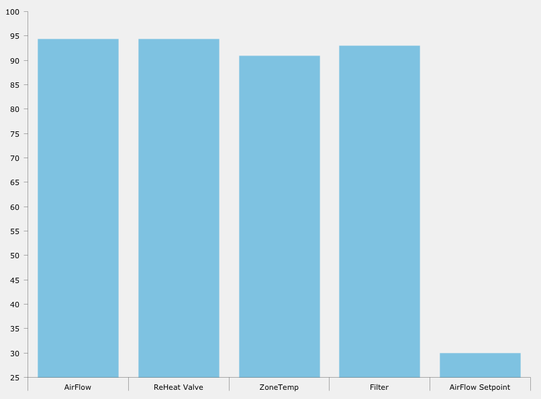
Start by dragging an AM Chart into the workspace. Next right click and select show/hide so that you will no longer be able to see it
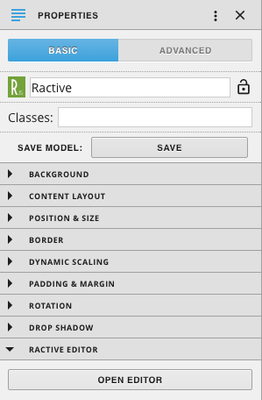
Next drag out Ractive and properties menu with Ractive selected, click Open Editor
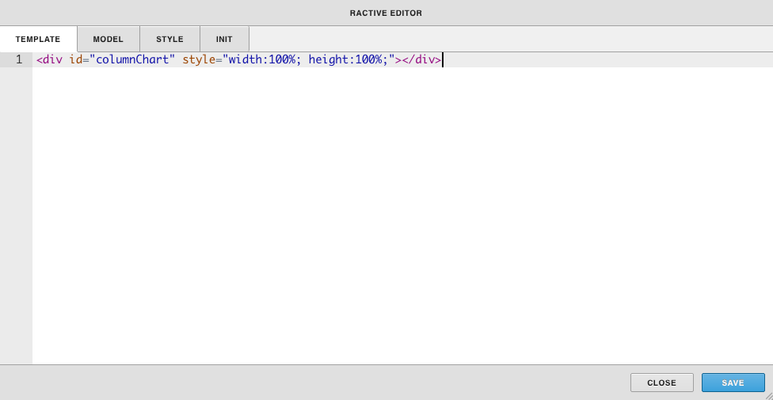
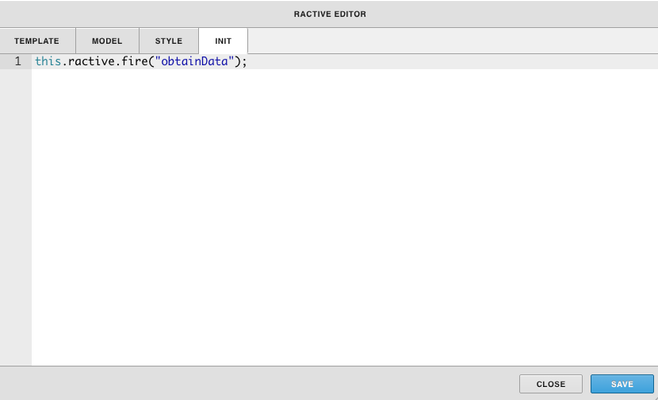
In the Ractive Editor copy and paste these lines of code below into the template section and init section and hit save
Template
<div id="columnChart" style="width:100%; height:100%;"></div>
Init
this.ractive.fire("obtainData");
Next were going to add the query
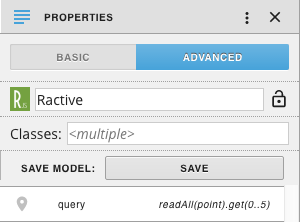
Under Properties and advanced add a tag with the value set to the desired query
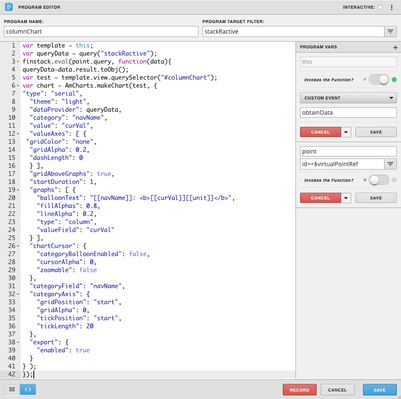
Next were going to add the program shown above.
- Start by going to Programs in the left menu and clicking the + icon.
- Under Program Name, name the program
- Under Program Target Filter type in stackRactive
- Click the three dots in the top right corner and select variables
- Click on the gear that appears as you hover over the word this
- Turn on invokes the function and change the dropdown to custom event
- In the box below type in obtainData and click the gray save button
- Then click the + icon to add a new variable and call it point and in the box under type in id==$virtualPointRef and click the gray save button
- Next copy and paste the code below into the main part of the program.
var template = this;
var queryData = query("stackRactive");
finstack.eval(point.query, function(data){
queryData=data.result.toObj();
var test = template.view.querySelector("#columnChart");
var chart = AmCharts.makeChart(test, {
"type": "serial",
  "theme": "light",
  "dataProvider": queryData,
  "category": "navName",
  "value": "curVal",
  "valueAxes": [ {
 "gridColor": "none",
  "gridAlpha": 0.2,
  "dashLength": 0
  } ],
  "gridAboveGraphs": true,
  "startDuration": 1,
  "graphs": [ {
    "balloonText": "[[navName]]: <b>[[curVal]][[unit]]</b>",
    "fillAlphas": 0.8,
    "lineAlpha": 0.2,
    "type": "column",
    "valueField": "curVal"
  } ],
  "chartCursor": {
    "categoryBalloonEnabled": false,
    "cursorAlpha": 0,
    "zoomable": false
  },
  "categoryField": "navName",
  "categoryAxis": {
    "gridPosition": "start",
    "gridAlpha": 0,
    "tickPosition": "start",
    "tickLength": 20
  },
  "export": {
    "enabled": true
  }
} );
});
Click the blue save button and your done!