| Table of Contents |
|---|
Debug
The Debug app allows the user get more info in regards to the installed version of FIN Stack and the hardware on which it is installed. This is very helpful when trying to debug an issue.
Using Debug
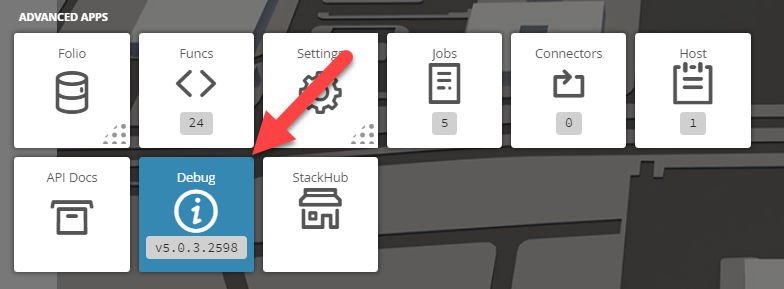
To use it, just select the Debug app , on the right side, under Advanced Apps
Debug Properties
Under the Debug App there are the following options divided between Info and Tools sections:
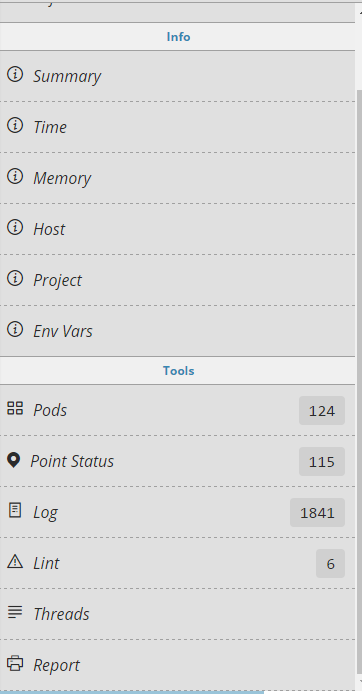
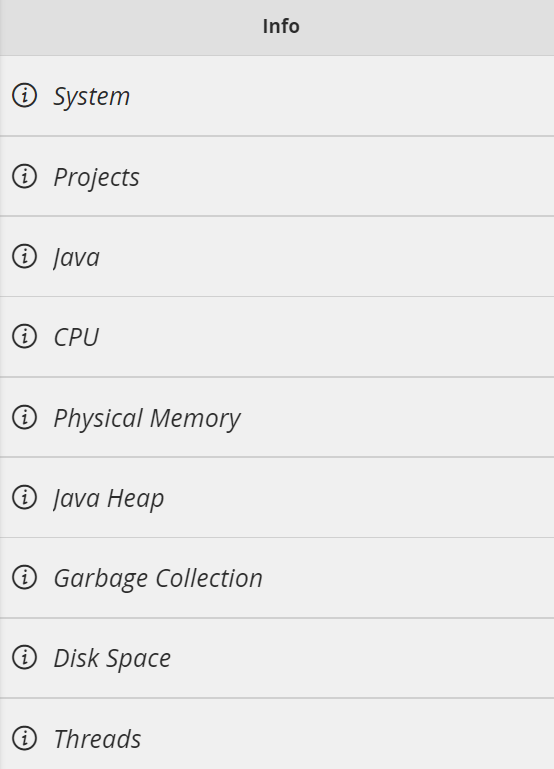
Info
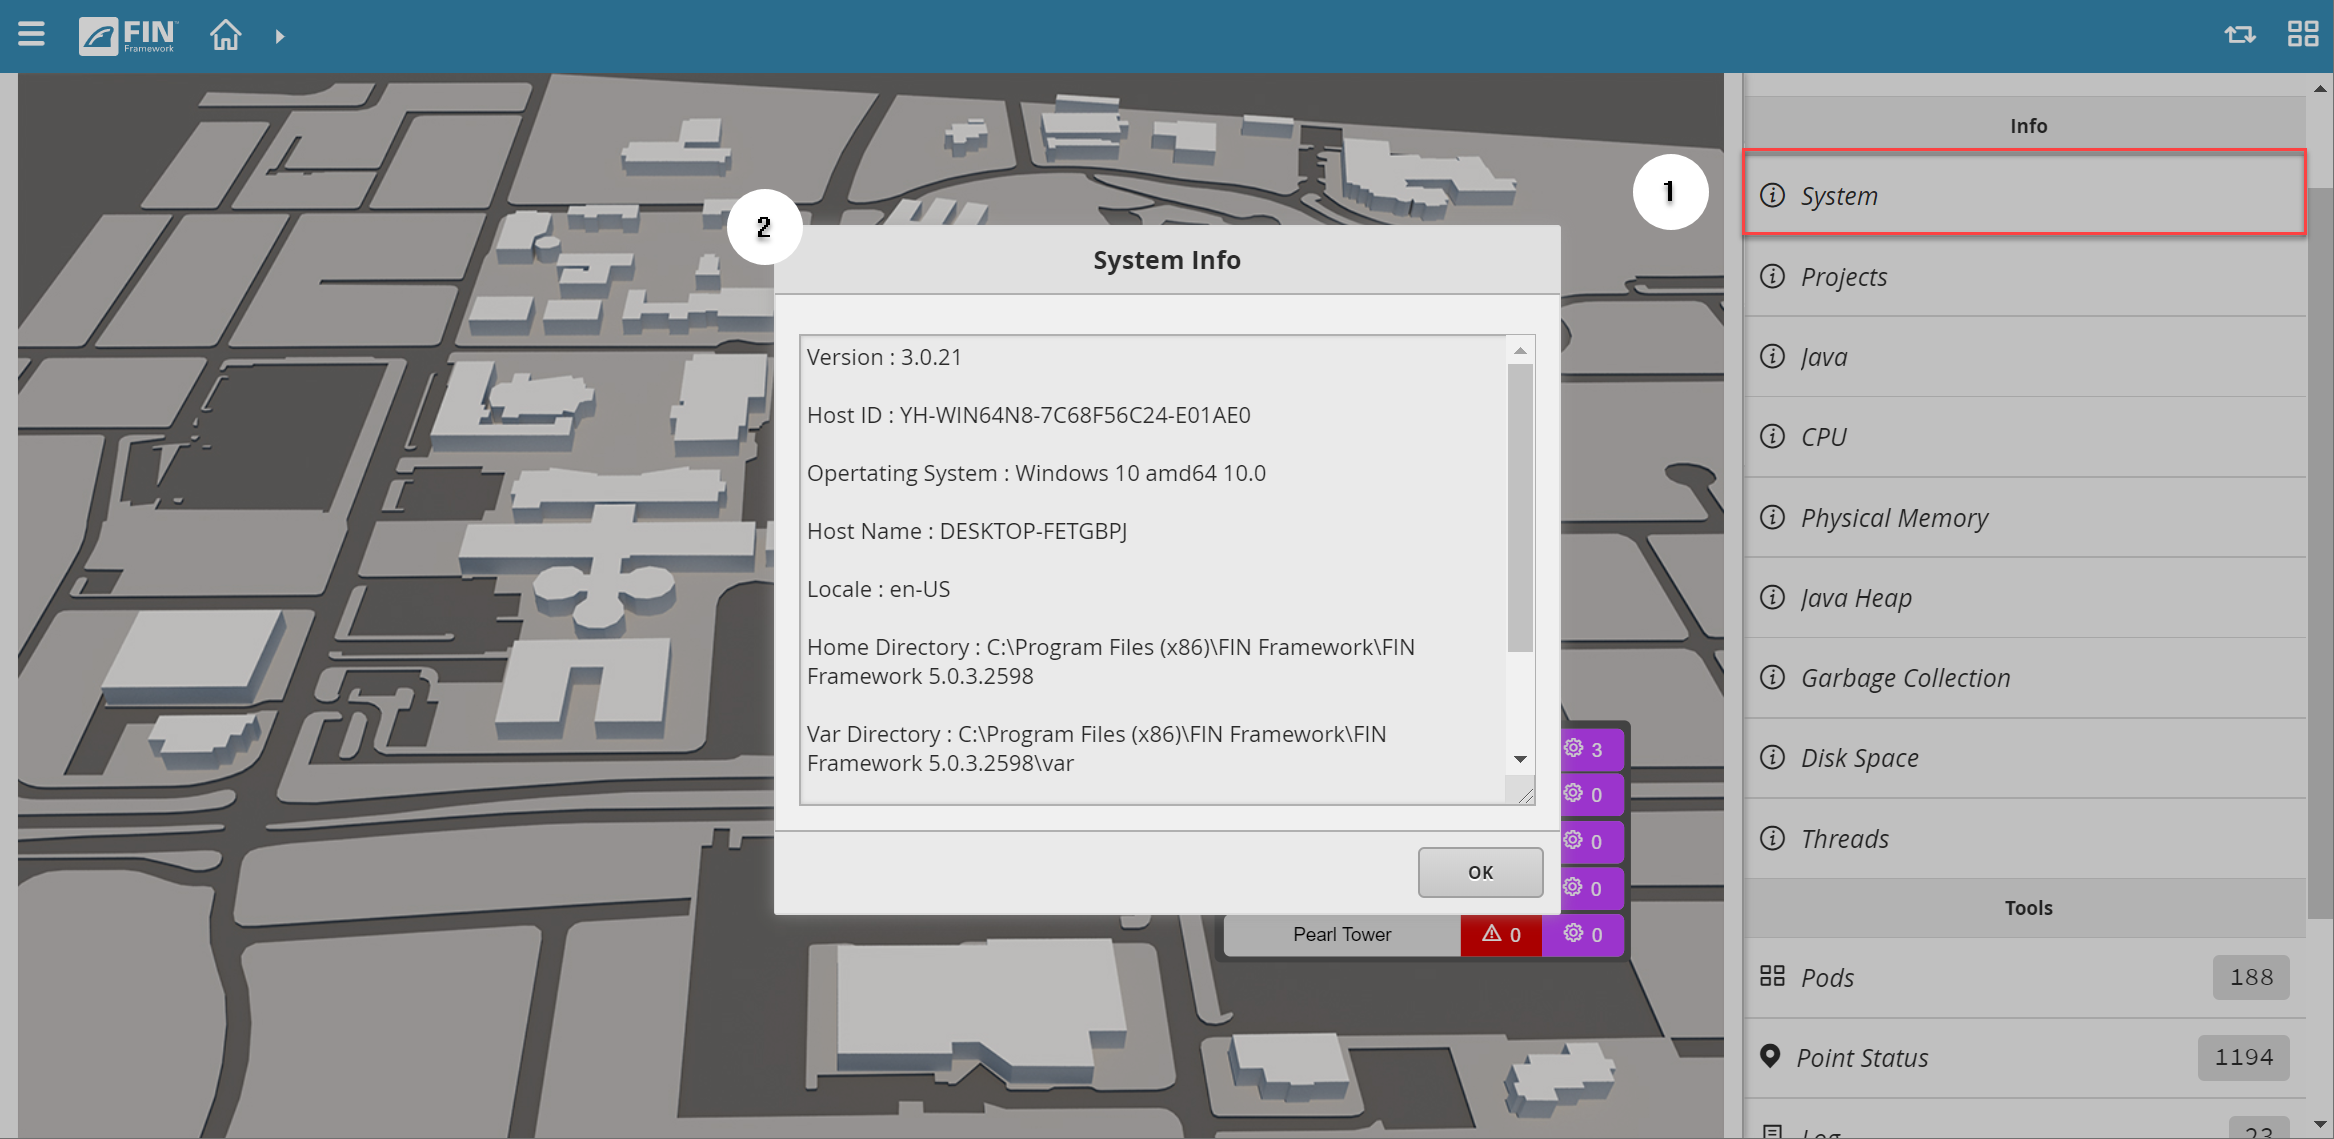
The Info section contains useful debugging information.
The Debug Info is divided further into:
- Summary
- Time
- Memory
- Host
- Project
- Env Vars
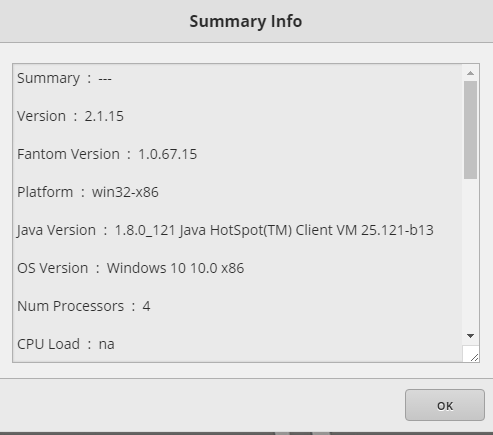
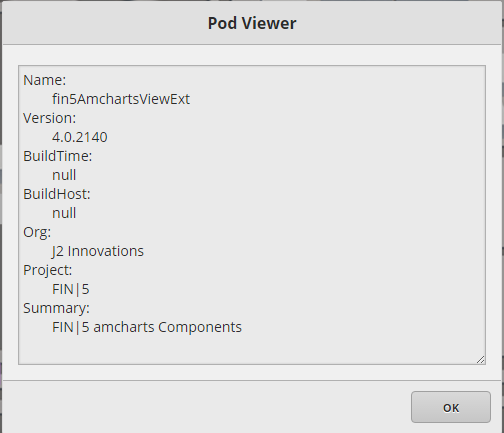
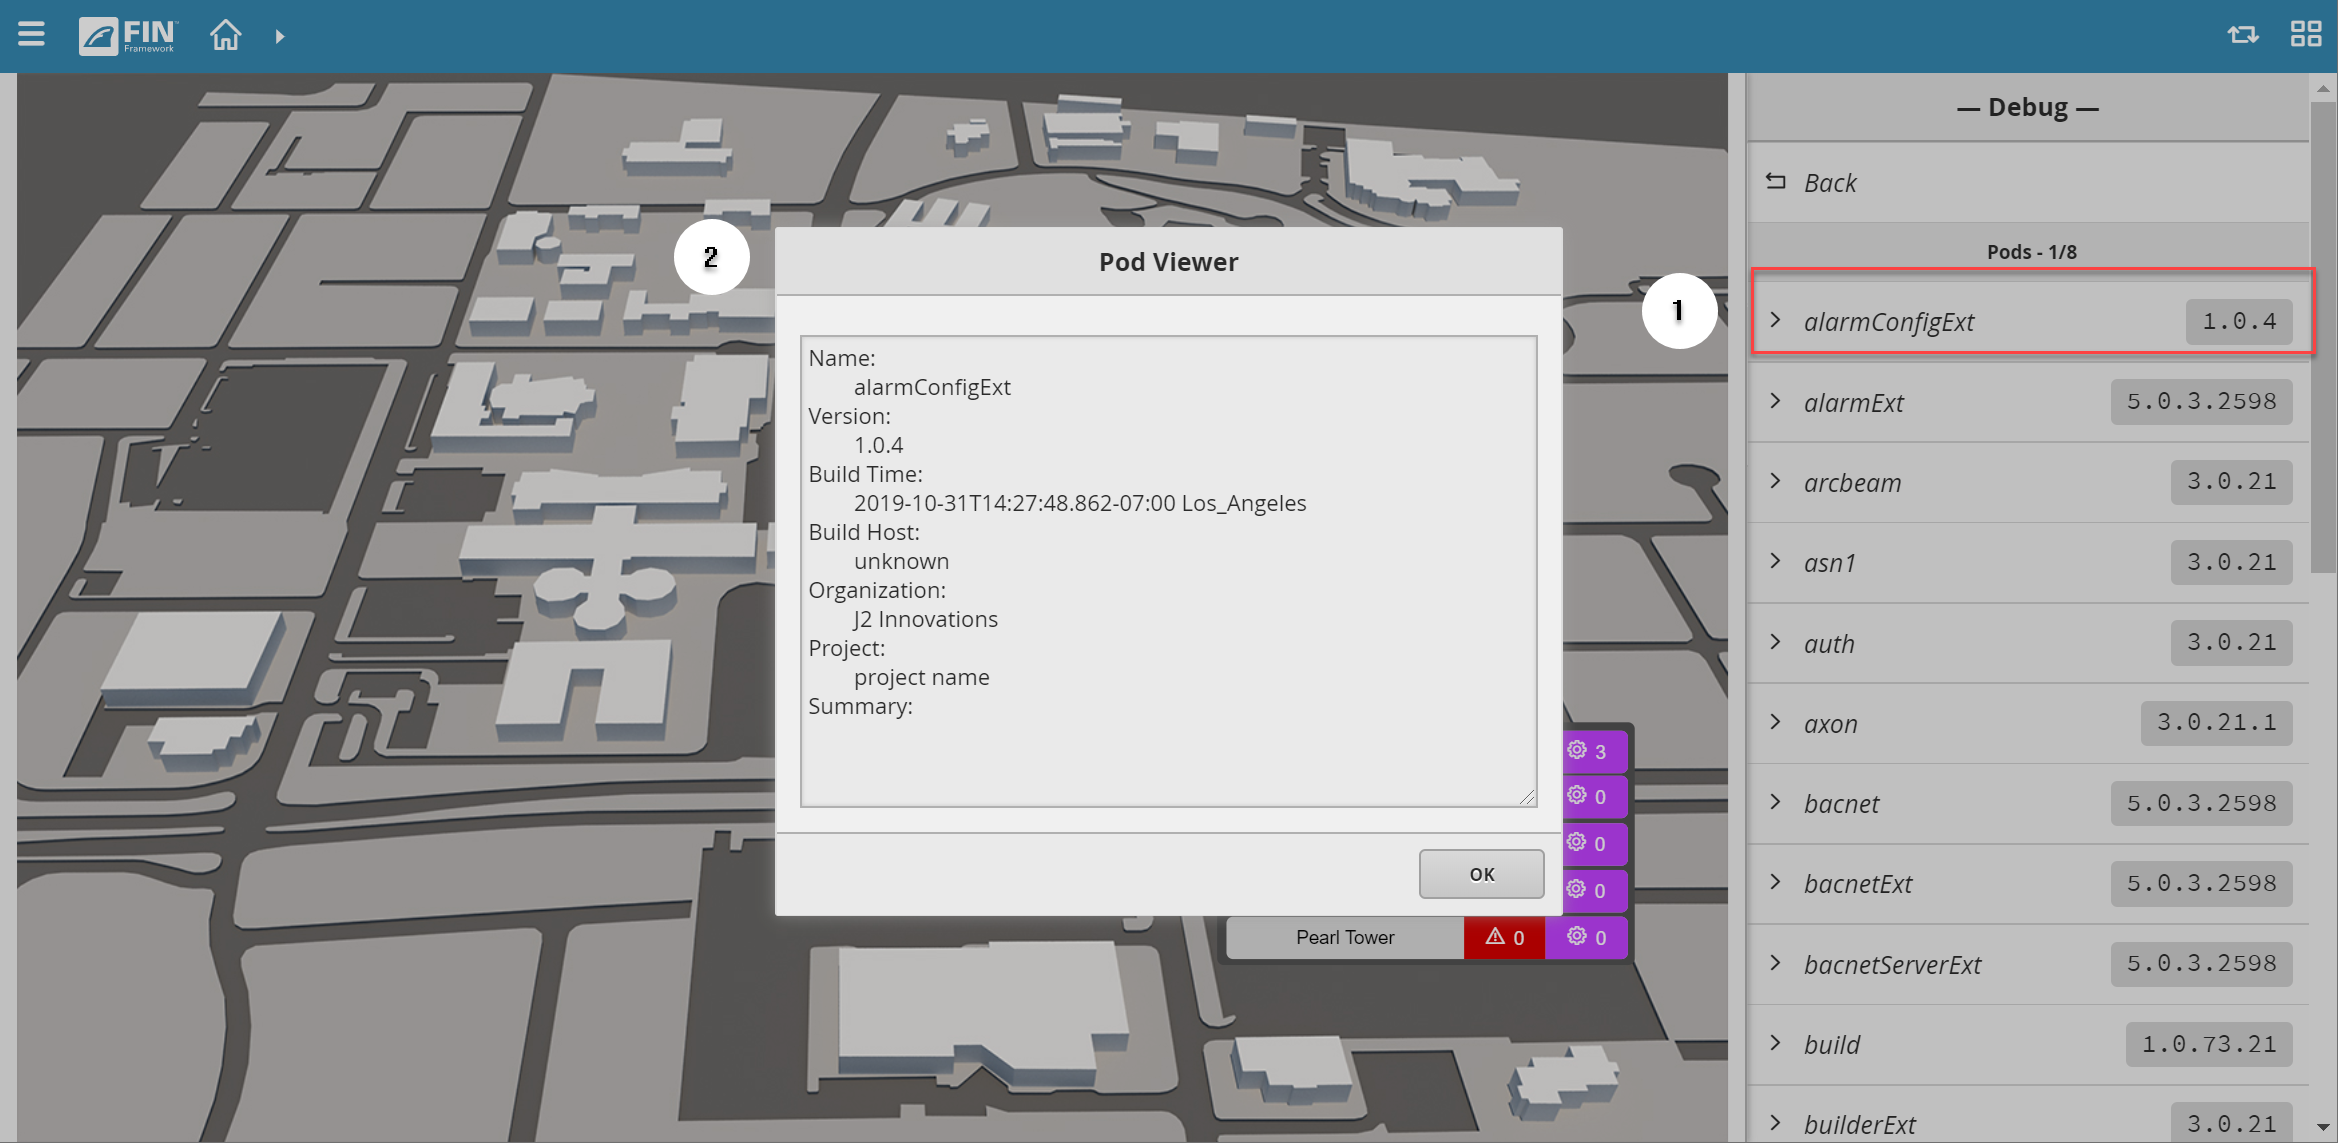
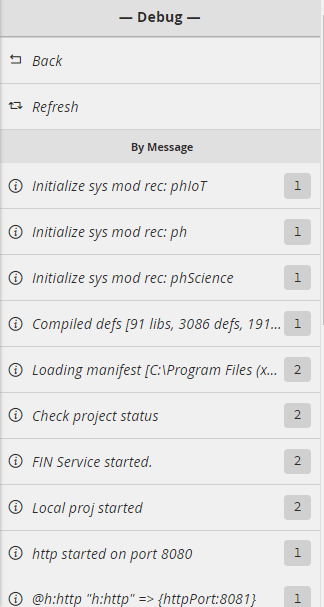
For example, clicking on Summary will yield a pop-up such as the one below:
| Table of Contents |
|---|
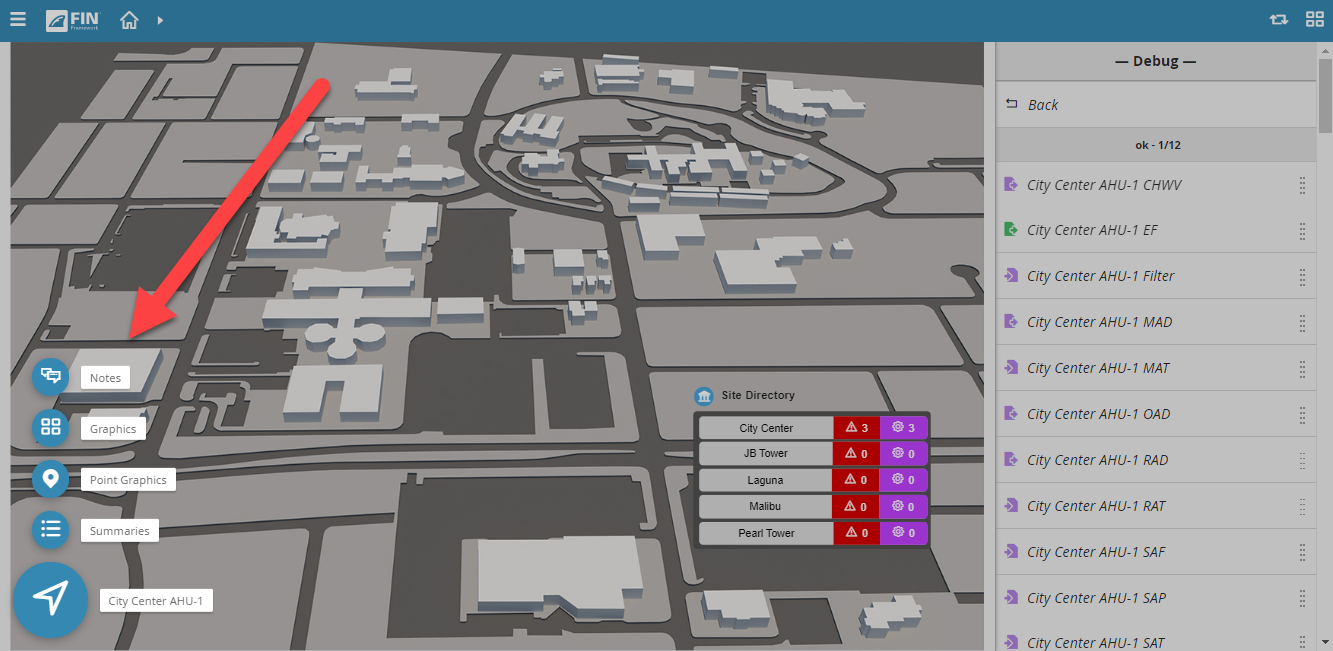
Location
1. The user will need to select on the Debug app underneath the Advanced Apps in the menu
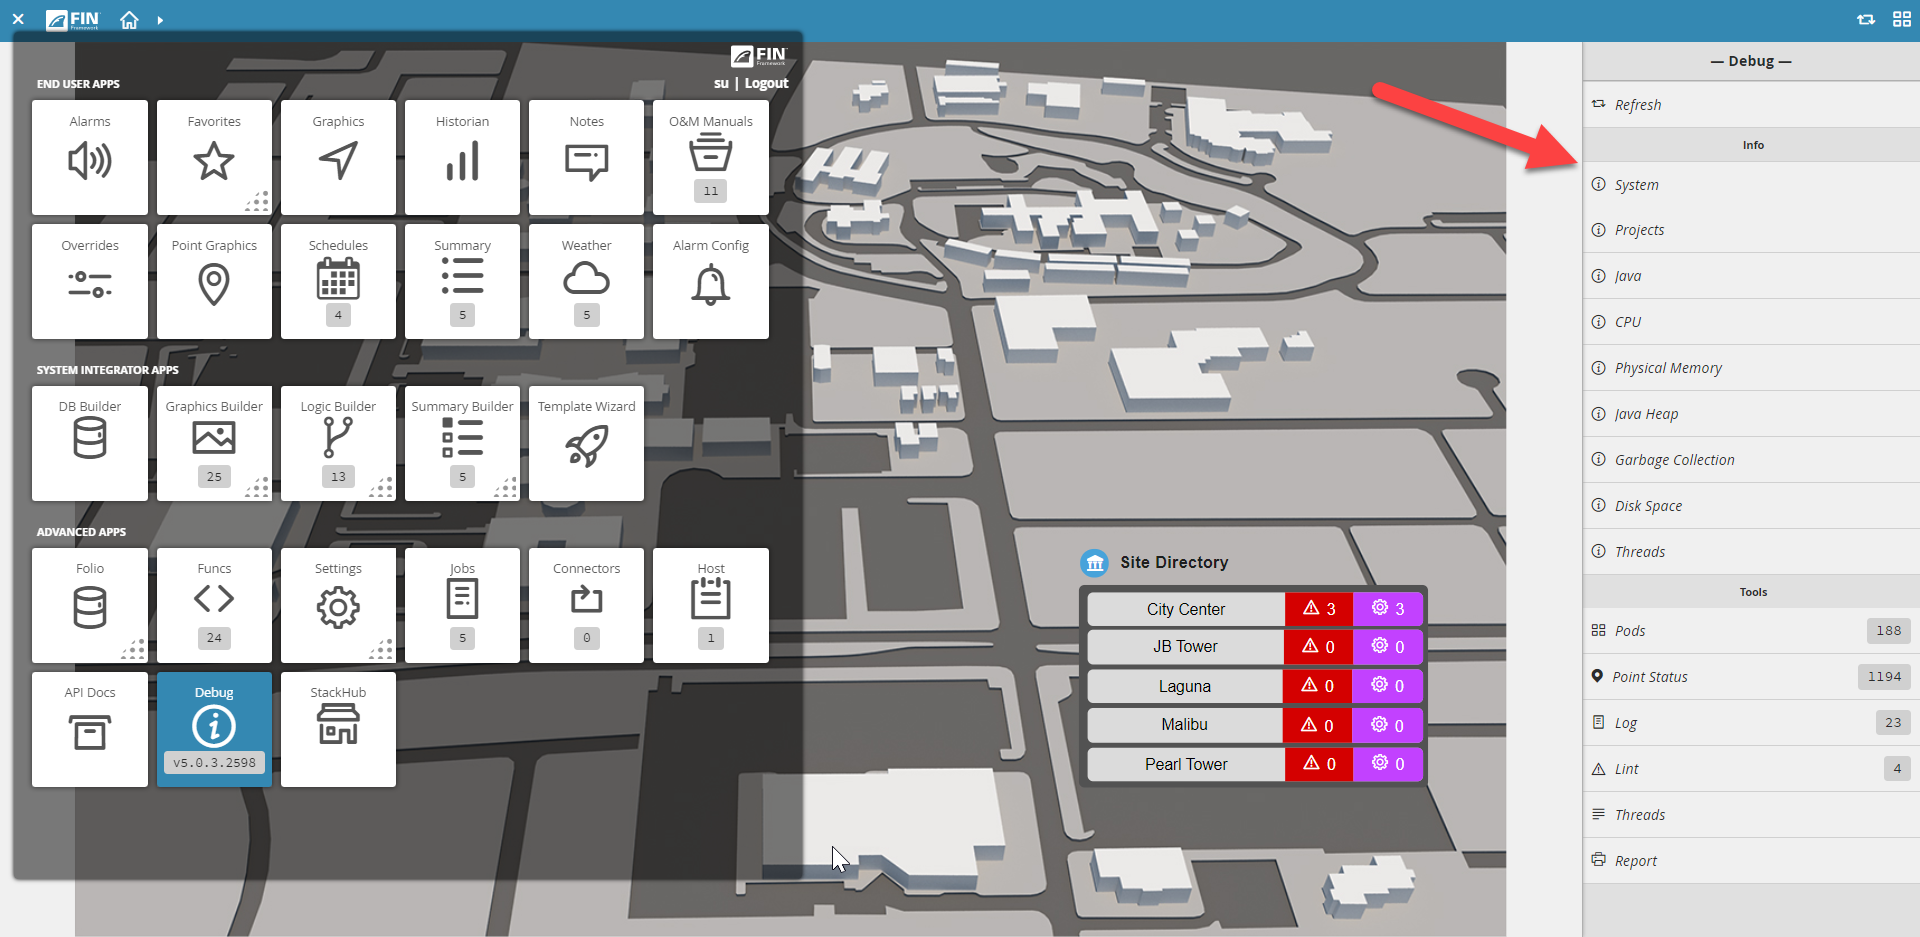
2. Once selected, a side menu will appear on the right-hand side. The user will be listed with various options as shown below
Debug Properties
There are two main sections in the Debug App - Info and Tools
Info
The Debug Info is divided by the following:
How to Use
If a user wants to get information for a particular option, they will just need:
1. Select on an option - any underneath the info section
2. Once selected, it will yield a pop-up in the middle
- The user is able to copy the text if they want to paste it on a word document
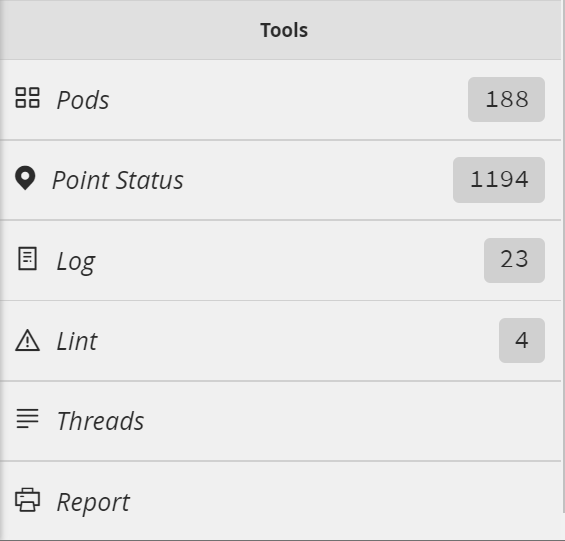
Tools
The tools section contains the following:
- Pods
- Point Status
- Log
- Lint
- Threads
- Report
Pods
Pods
Lists the number number of pods installed on the Finstack Platform.Clicking on Pods will display a list with
How to Use
1. The user will need to select on the Pods section, this will list all the pods installed along with their the version number on the right-side.
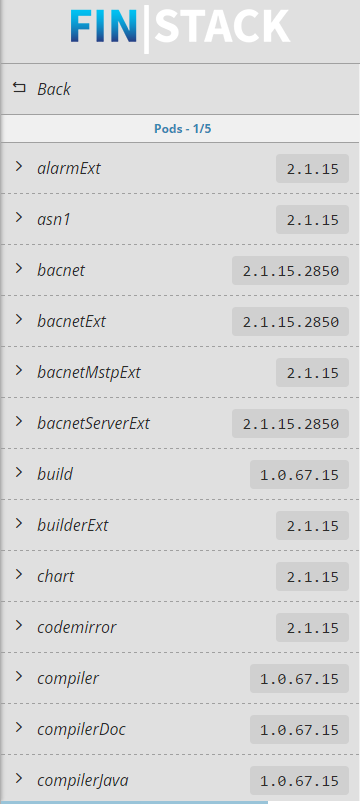
Clicking 2. After selecting one of the pods, it will launch a Pod Viewer windows window containing detailed information.
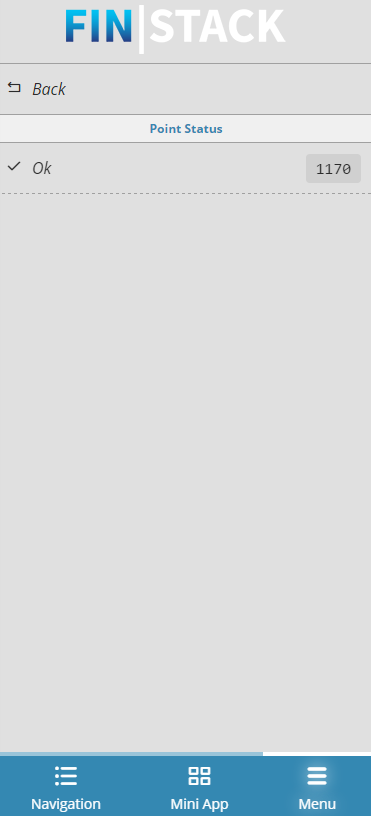
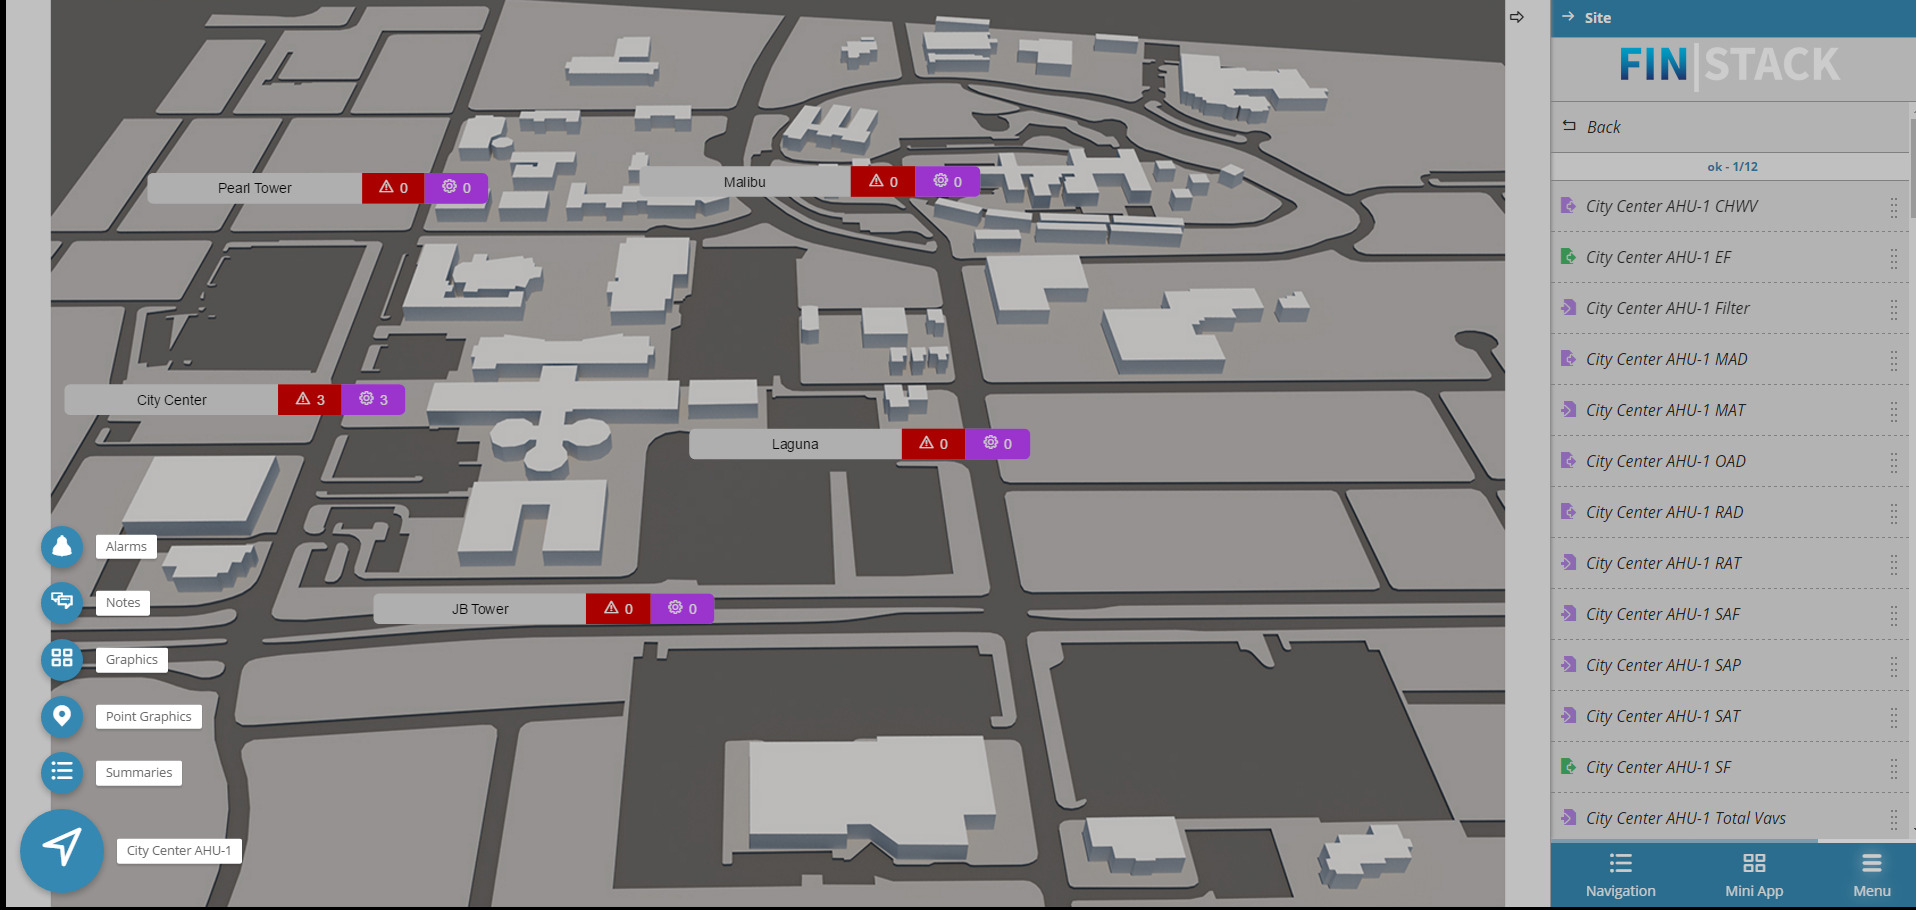
Point Status
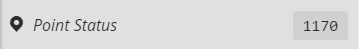
Lists the points in the current project sorted by their status.
Clicking on one of the options 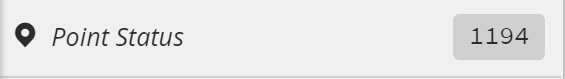
How to use
1. The user will need to select on the Point Status section, it will list all the points that have an Okay status
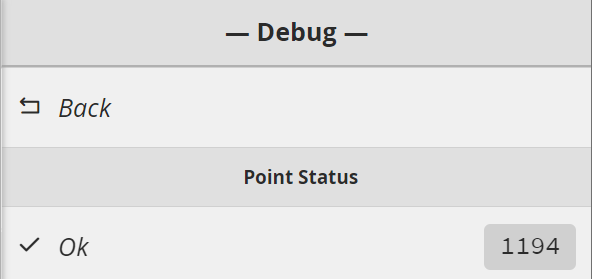
2. If the user selects on the Ok option, it will show a list with all the points currently under that status.
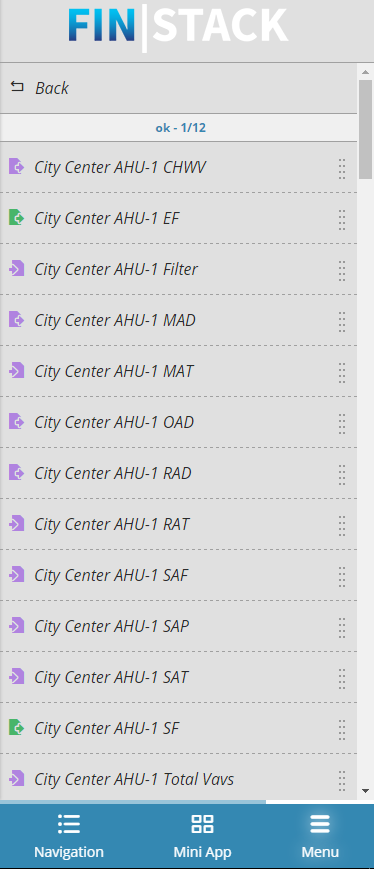
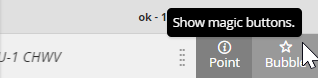
- The
...
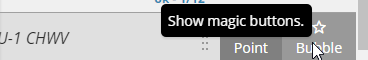
- user can select on the points and be displayed with the following options - Points and Bubble
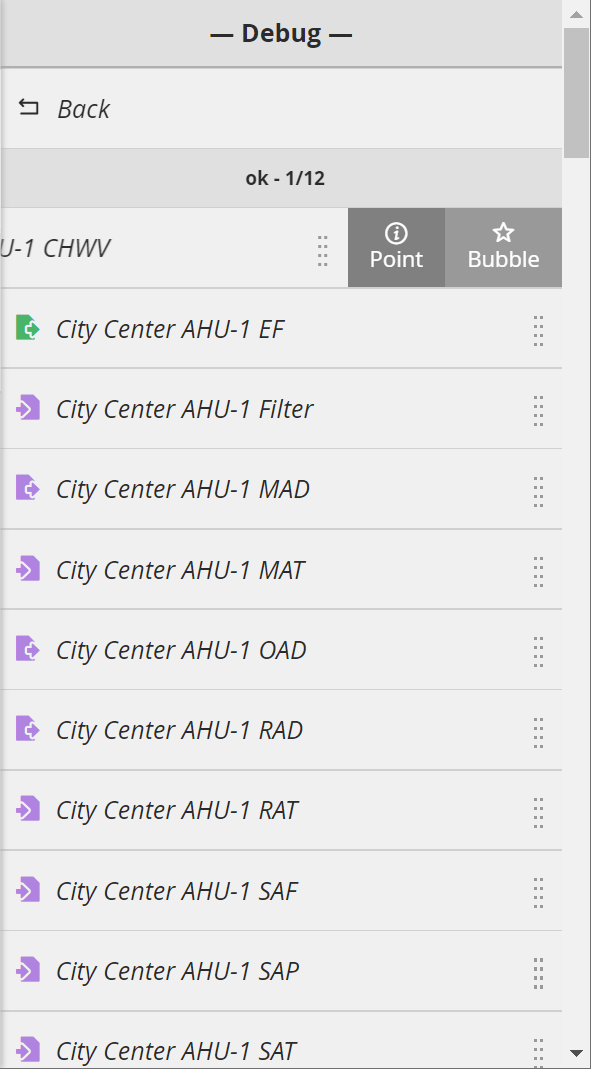
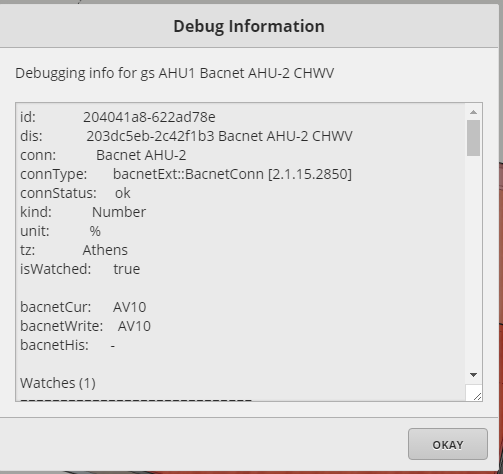
Point
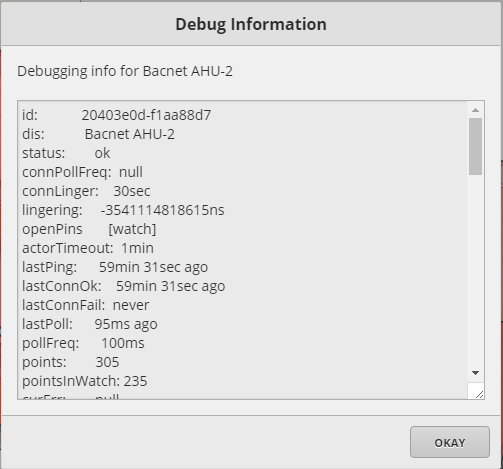
Clicking on point will display that point's debug information.

Connector
If the point is linked to a connector the Connector debug info button will be available. Clicking it will show the Connector debug information.
Bubble
The Bubble button will launch the Magic Bubbles with options related to that point.
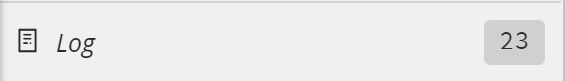
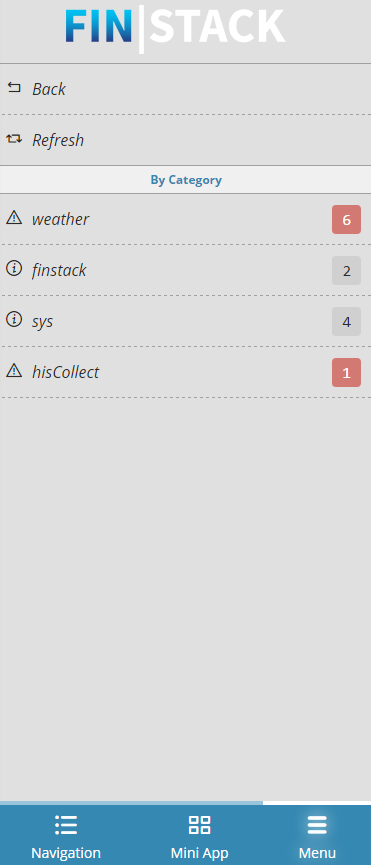
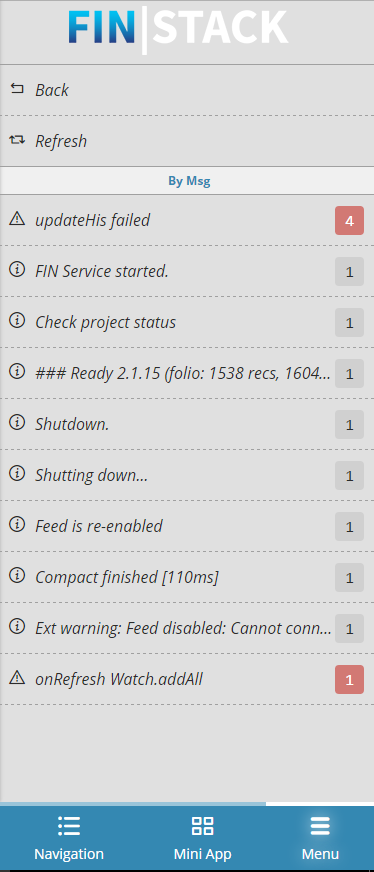
Log
...
The Log menu is the section that displays all the log messages. This is very useful to check errors and debug issues.
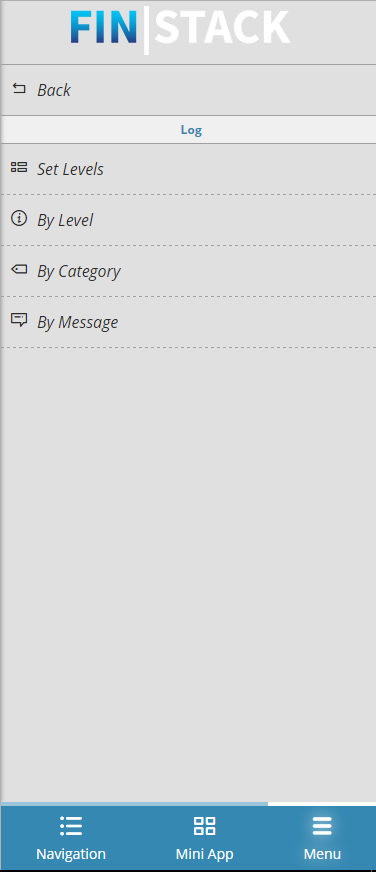
Set Levels
This allows setting log levels for each category.Clicking it will display a form where levels can be set separately for each category
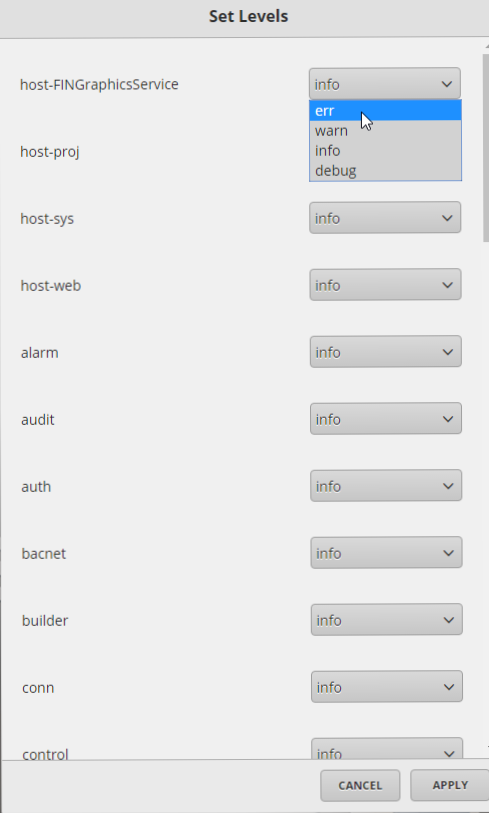
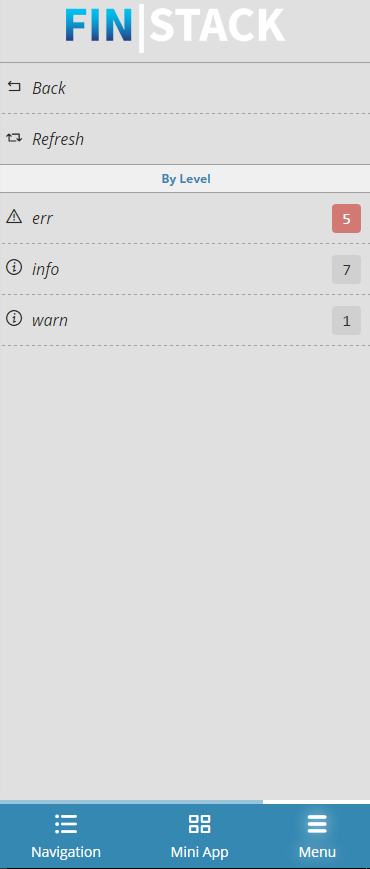
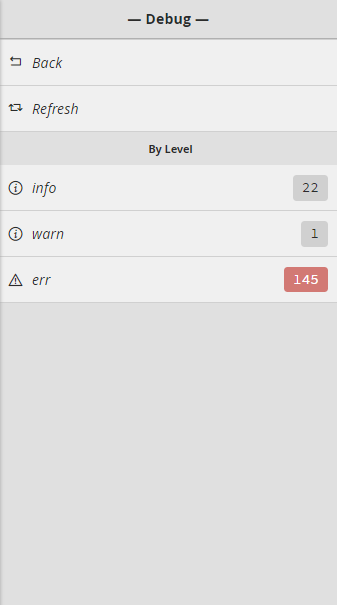
The log messages can be viewed under 3 2 categories, By Level , By Category or By Message:
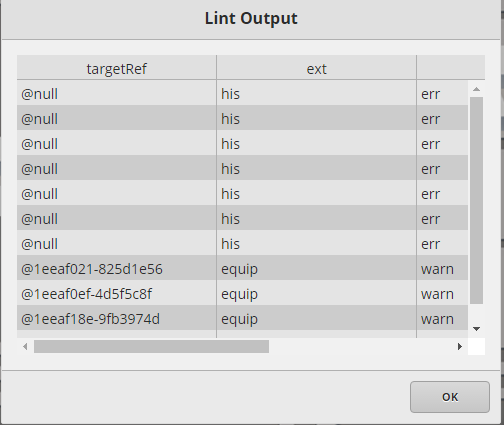
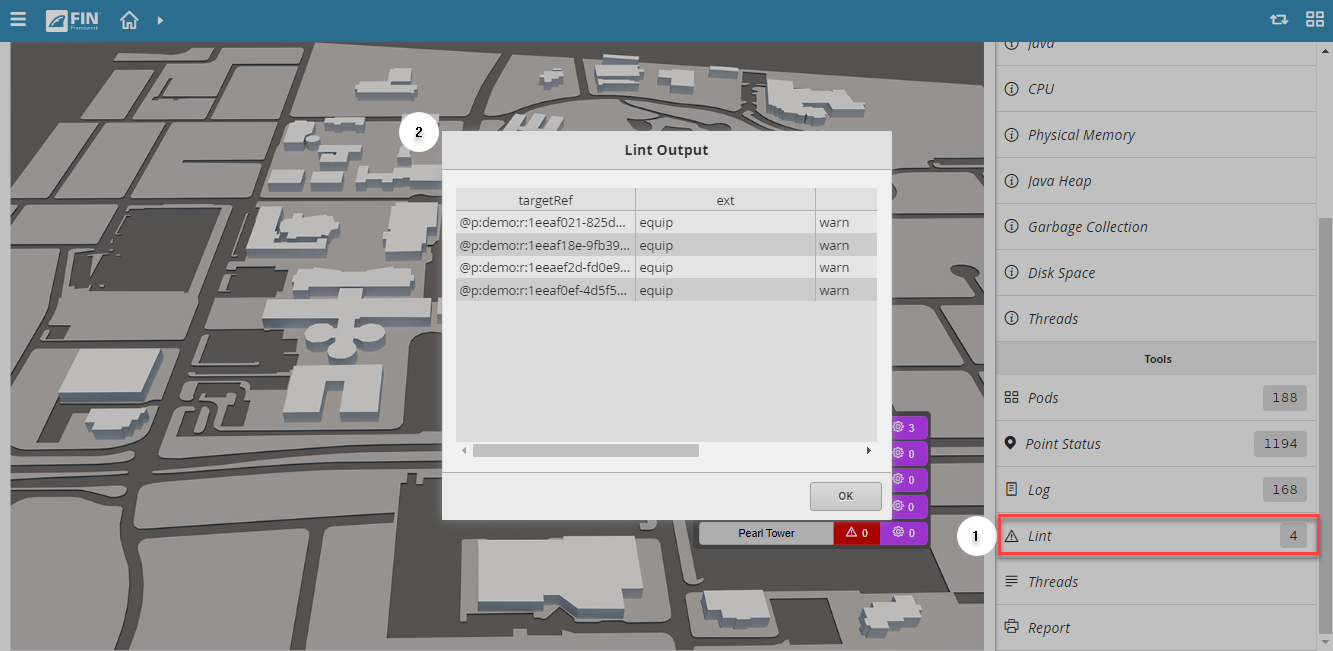
Lint
The Lint sub-menu will display a list of all the errors and warnings that have been triggered by the running software. Clicking it will display the Lint Output with further details.
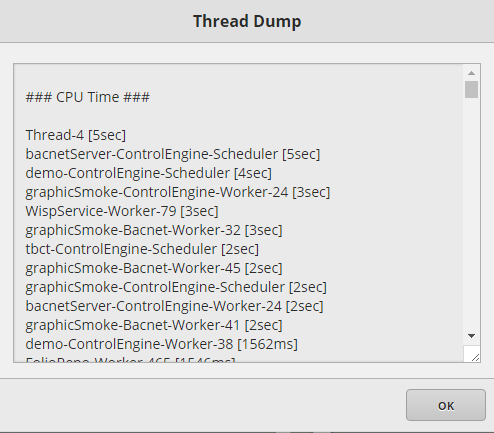
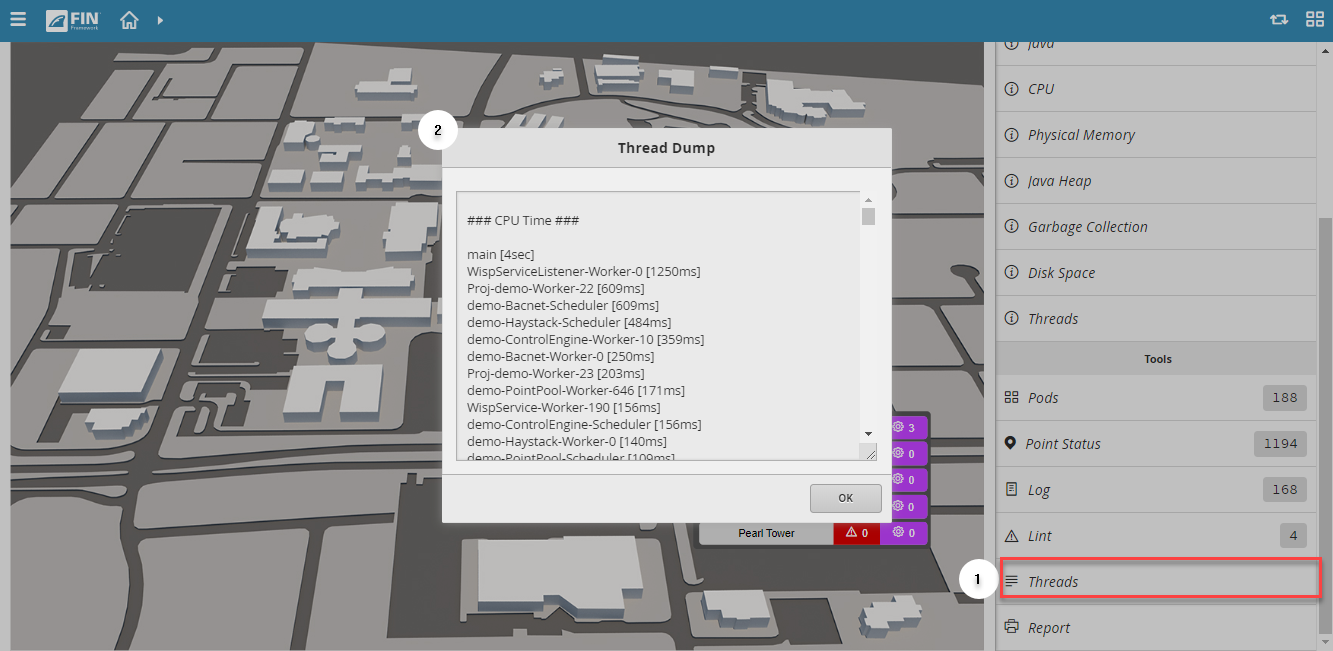
Threads
The Threads menu will display a CPU Thread Dump- useful for troubleshooting.
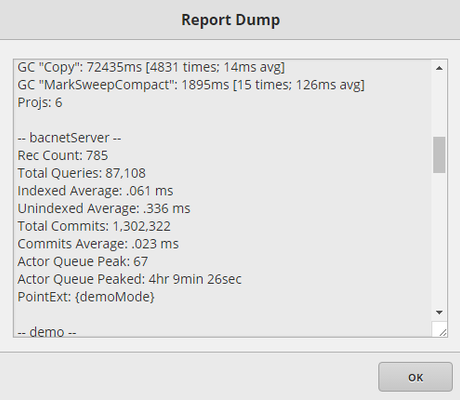
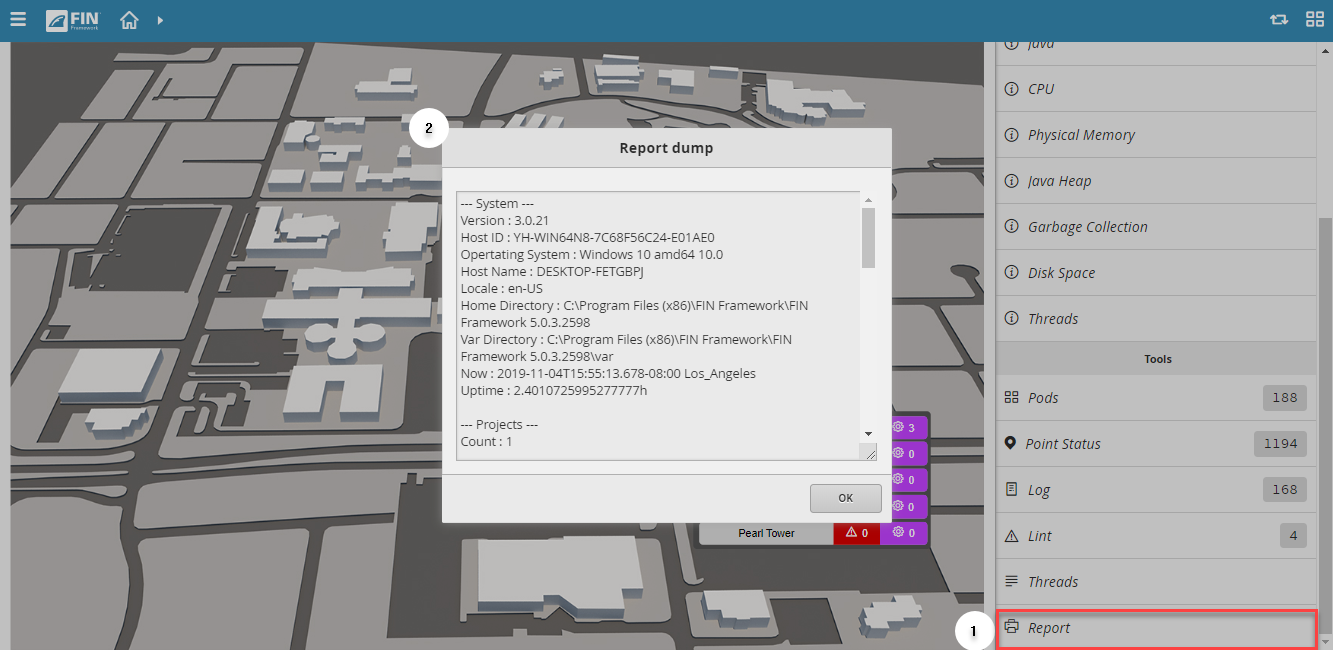
Report
Report option will display a concise report of the FIN Stack installed version, hardware usage, and database size.