...
| Icon | Name | Builder View | Description |
|---|---|---|---|
 | AM|Chart |  | AM|Charts can be used to display data from a query or points. They are used in combination with a program and a group. It can display the historical data of point(s). An example query this: read(id==@1eeb0007-121ebcfe).hisRead(yesterday). More examples can be found here: GB AM Charts Here is another example:https://finproducts.atlassian.net/wiki/spaces/FINStack/pages/48136198/GB+Custom+ GB Custom Charts |
 | Data Grid |  | It’s based on a virtualPoint with a query tag. For example, create virtualPoint. Add query tag with value being “site”. Then bind to the component. Shows grid of all site data in preview.
|
 | Gauge |  | Can be defined in the properties panel under basic. There can be a label, min, max, and value. This is also where the color can be changed. |
 | AM|Gauge |  | AM|Gauge can be used in combination with a group and a program to show one of the gauges from AM|Charts. An example of an AM|Gauge can be found here:https://finproducts.atlassian.net/ /wiki/spaces/FINStackFINFramework/pages/93416517/Solid+Gauge770708694 |
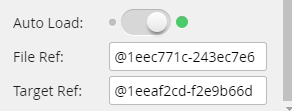
 | Graphic Include |  | Auto Load determines if the include loads the graphic at first launch or loaded when triggered by something else. This is meant to display graphics. It takes the id without the “id==” of both the graphic and target.
|
 | Group |  | Works the same as selecting multiple objects and right clicking > create group. Can view and add components to the group in the Layers panel or by selecting, holding Ctrl and drag/drop on group component until you see a dark border
|
 | Basic Image | | |
 | Image Renderer | | |
 | Kiosk |  | |
 | Maps |  |
|
 | MJPEG |  | |
 | Model Loader | | This is basically models. If you group some components, then save them as model in properties. You can then use them from Components panel or drag it out from Assets to modify. |
 | Ractive | | Drag and drop Ractive from the components menu into the workspace. In the Properties panel on the basic tab, under Ractive Editor, click Open Editor. In the Ractive Editor, HTML goes in Template, Ractive in Model, CSS in Style, and Javascript in INIT. More examples can be found here: GB Ractive |
 | SVG | | |
 | Timer |  | The time can be used to set a delay or have something run and keep refreshing. It will disappear so it won’t be visible in the viewer, but will run in the background using tags that can be set on programs and other components. Example on program is creating a timer var like below.
|


...
More examples can be found at:
https://finproducts.atlassian.net/wiki/spaces/FINStack/pages/93414870/GB + AM + Charts
https://finproducts.atlassian.net/wiki/spaces/FINStack/pages/48136198/GB + Custom + Charts
Data Grid
Displays a spreadsheet-like view of data depending on the query property attached to a virtual point.
...
Drag and drop Ractive from the components menu into the workspace. In the Properties panel on the basic tab, under Ractive Editor, click Open Editor. In the Ractive Editor, HTML goes in Template, Ractive in Model, CSS in Style, and Javascript in INIT. More examples can be found here:https://finproducts.atlassian.net/wiki/spaces/FINStack/pages/91603570/GB+ GB Ractive
SVG
Needs “fileRef” tag with the id of the svg file.
...