- This pulls up Actions when a point is clicked
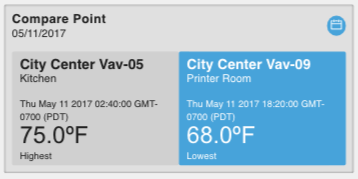
This has a date picker and will compare the highest and lowest from that selected time period
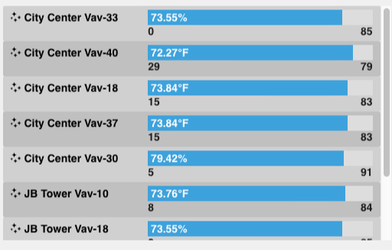
This bar chart can be changed to display different, and has magic bubbles
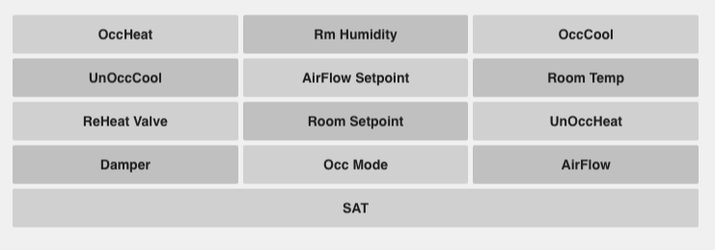
- This will pull up all the points on an equip, and has actions and magic bubbles
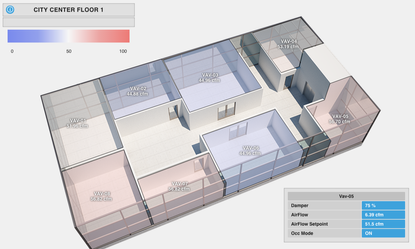
This model must be on a floor, and will change depending on which poly is selected
This is a heat map
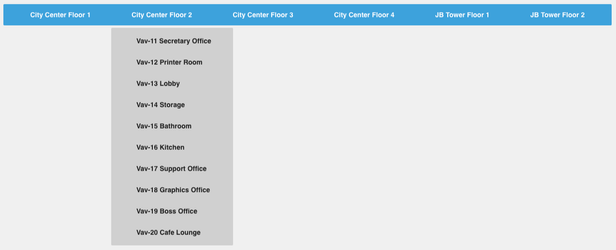
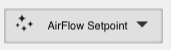
This is a horizontal dropdown menu that pulls up magic bubbles
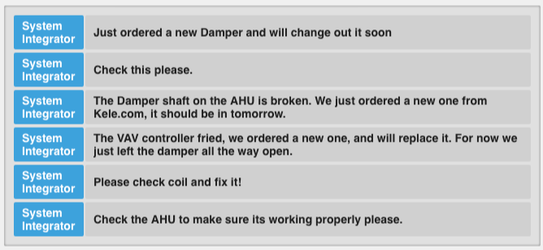
- This is a list that shows the notes
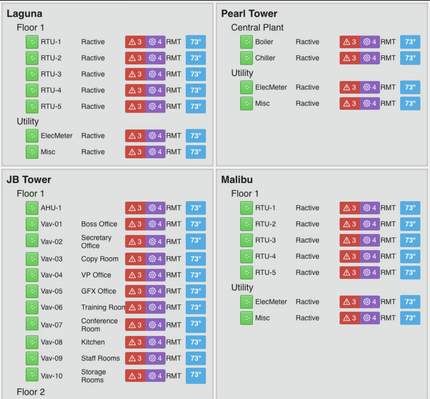
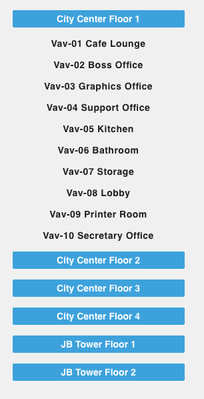
- This allows the user to view all their sites, floors, and equips in one place
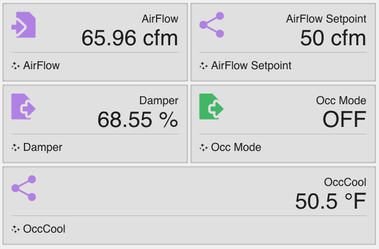
- Here is a simpler version of the dashboard
- Here is a list of points that shows actions if available and pulls up magic bubbles
- This is a dropdown that will display magic bubbles
- This shows users how to query based off a virtual point
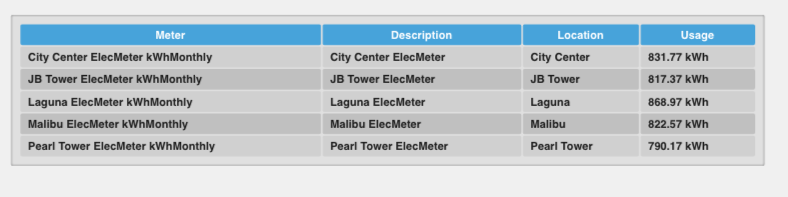
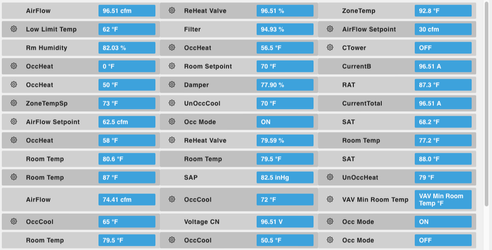
- This is a table that will also sort by clicking on the header
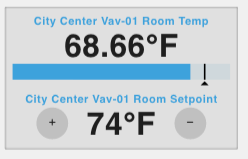
- This model allows the user to change the setpoint
- This is a dropdown that pulls up magic bubbles
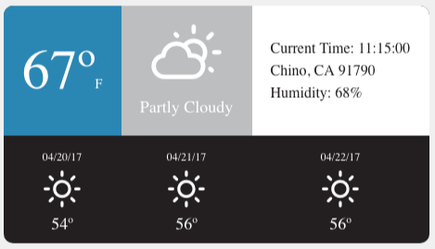
- This model displays the weather
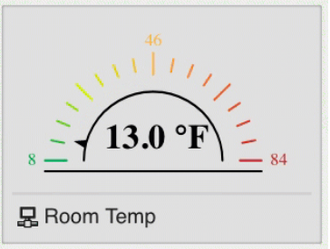
- This is a gauge based off a virtual point
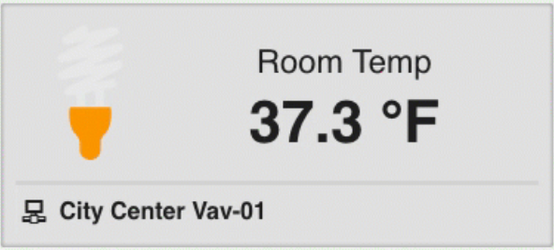
- This is an icon gauge based off a virtual point
- This allows the user to control the setpoint and has actions
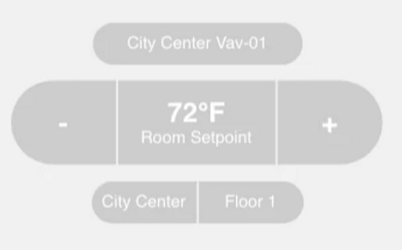
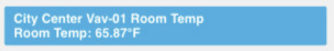
- This is the simple version of the setPoint for the room temp