Debug Info
- Ricky Villa
- George Vilcu (Unlicensed)
- Kimberly Cruz (Unlicensed)
The Debug Info form allows the user to view information about selected connectors in one single view
Navigation
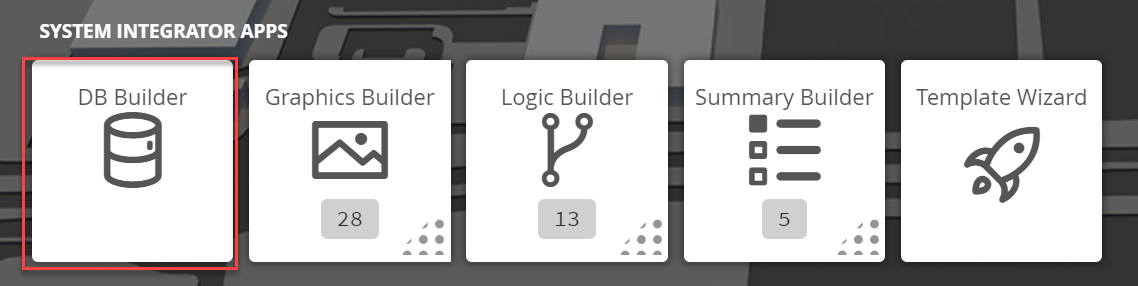
1. The user will have to navigate to the DB Builder tile which will be underneath the System Integrator Applications section
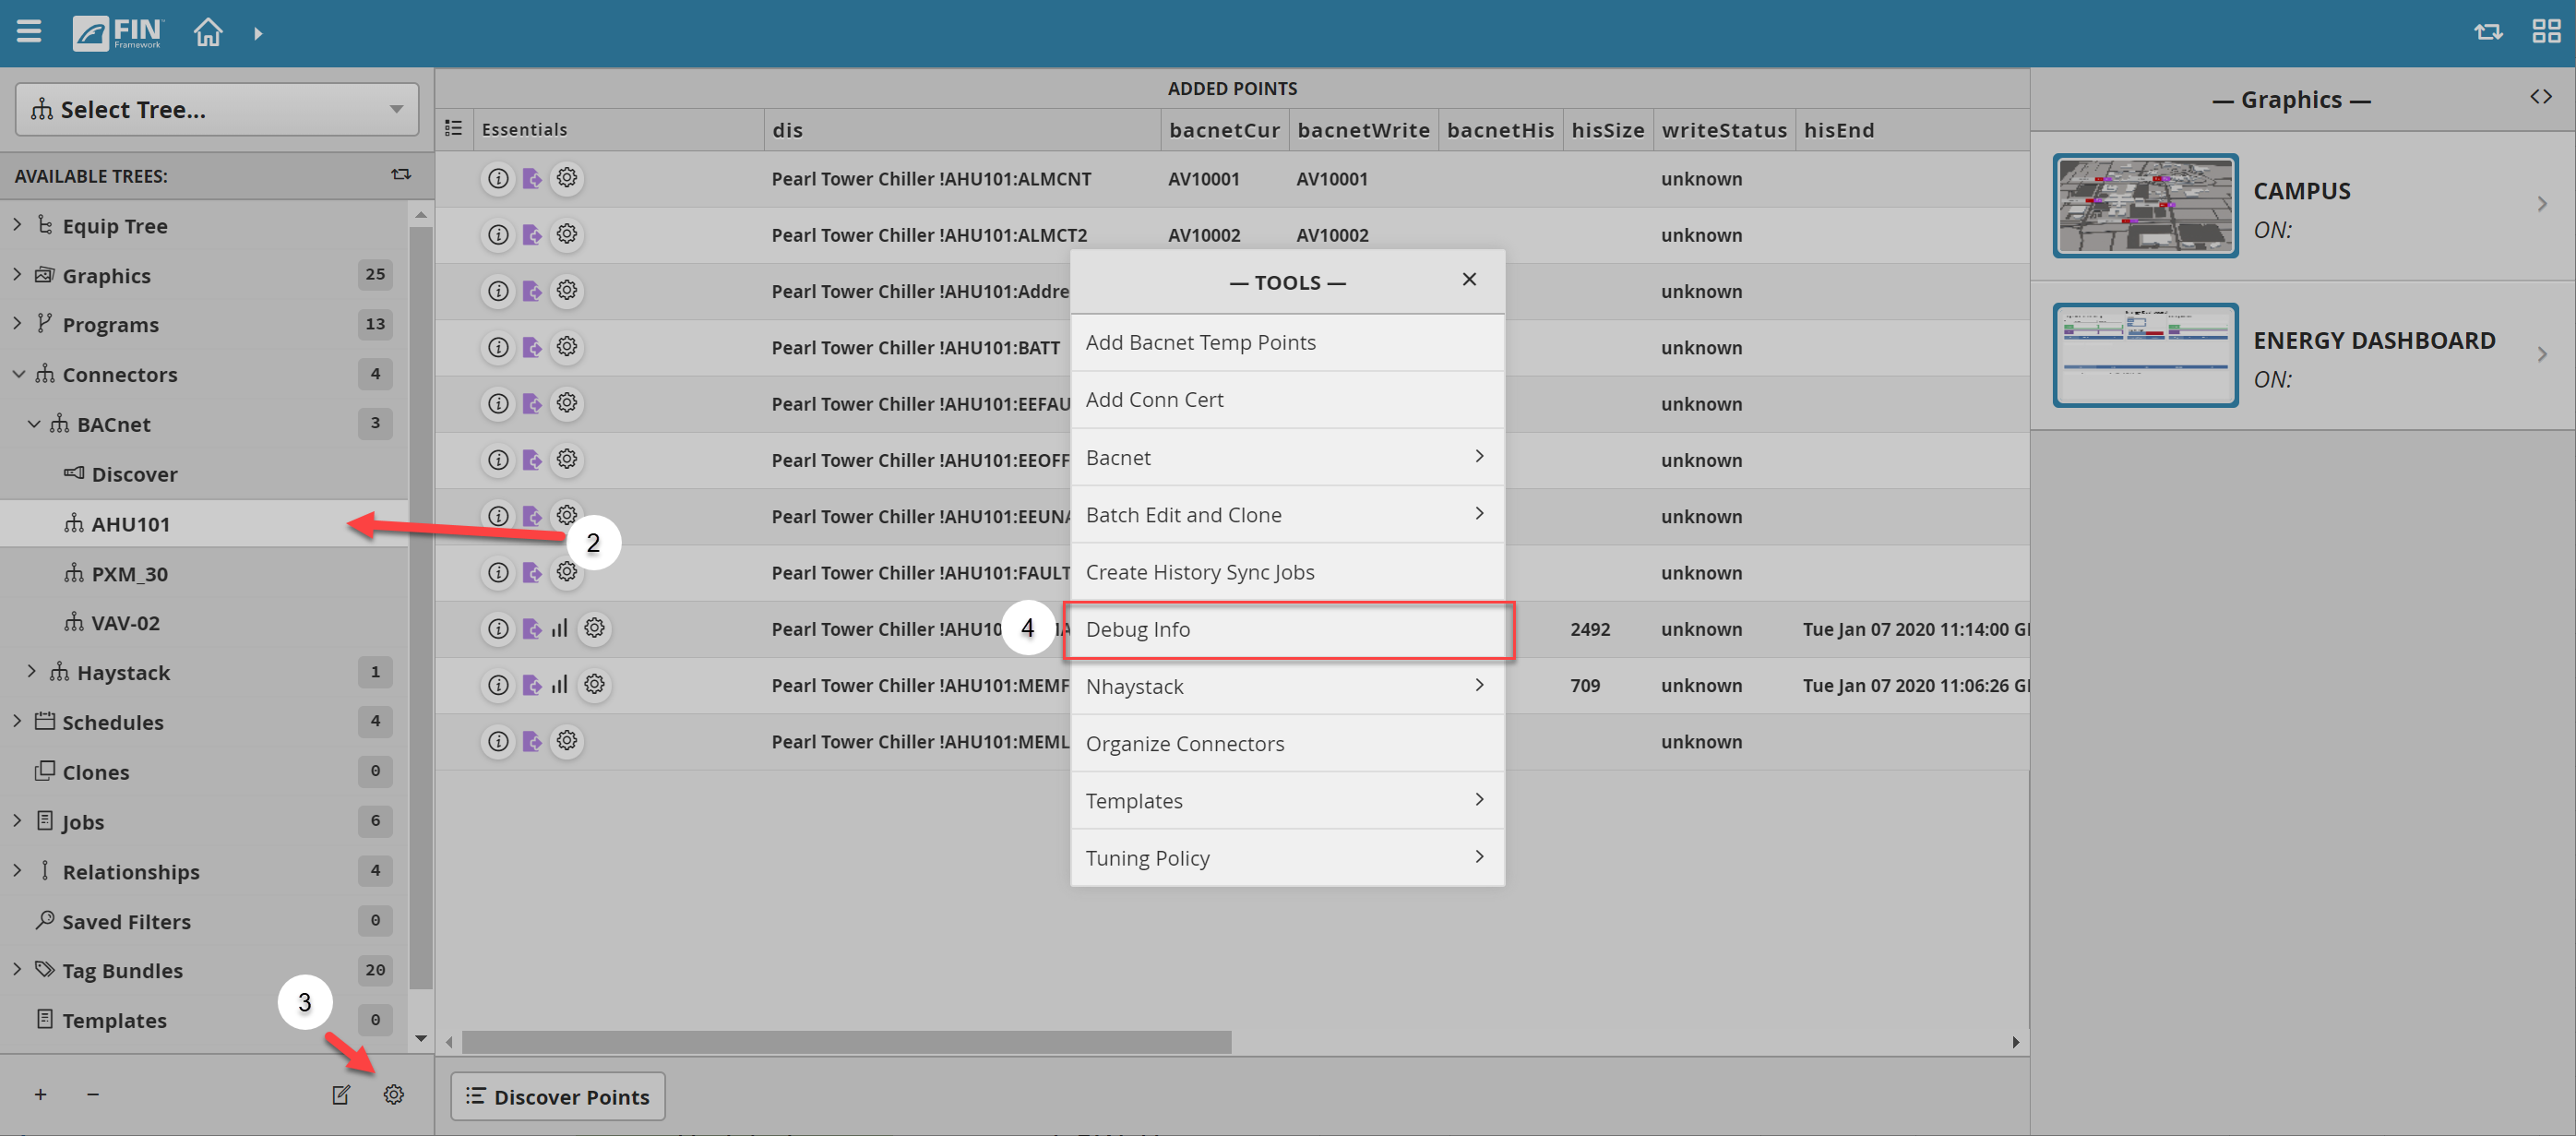
2. Once inside, the user has to navigate towards the Connector Tree > BACnet
- Underneath the Discover section, it will display a list of connectors that have been added by the user
- The user will have to select on a connector
- If there are no connectors, the user will have to add them by using the Discover button
- For more information, it can be found in the following document: BACnet Connector
3. Once a connector has been selected, the user will have to use the Tool button ![]() which is located on the bottom right
which is located on the bottom right
4. The user will be prompted with a pop-up called Tools where the user will have to navigate to the following: Debug Info
3. After clicking it, a window will pop-up called Debug Info
- The form will show different information depending on the type of connector the user selected (can be either Bacnet or Haystack)
Among the information displayed for both type of connectors, the user can see:
- the ID of the connector
- the displayed name
- the status
- the last ping
- the last poll
- last time the connector failed (lastConnFail)
- points from the connector that exists in the database
- Actor and ActorPool
| BACnet | Haystack |
|---|---|
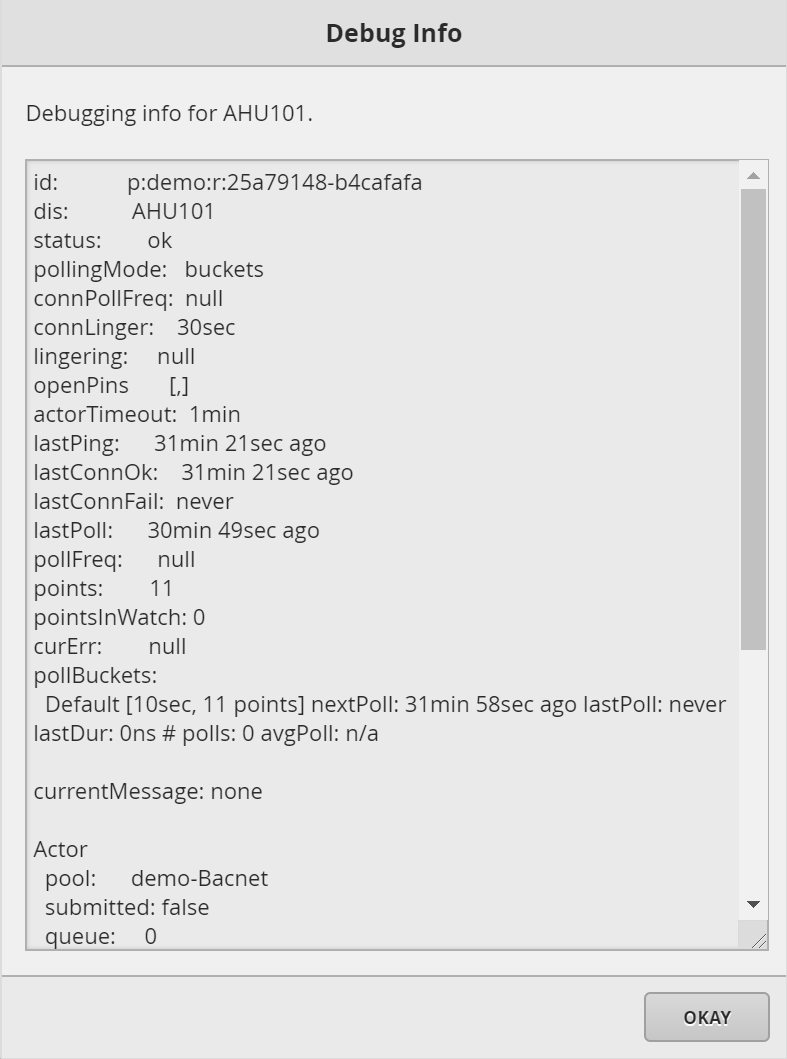 For BACnet connectors the user can see:
| 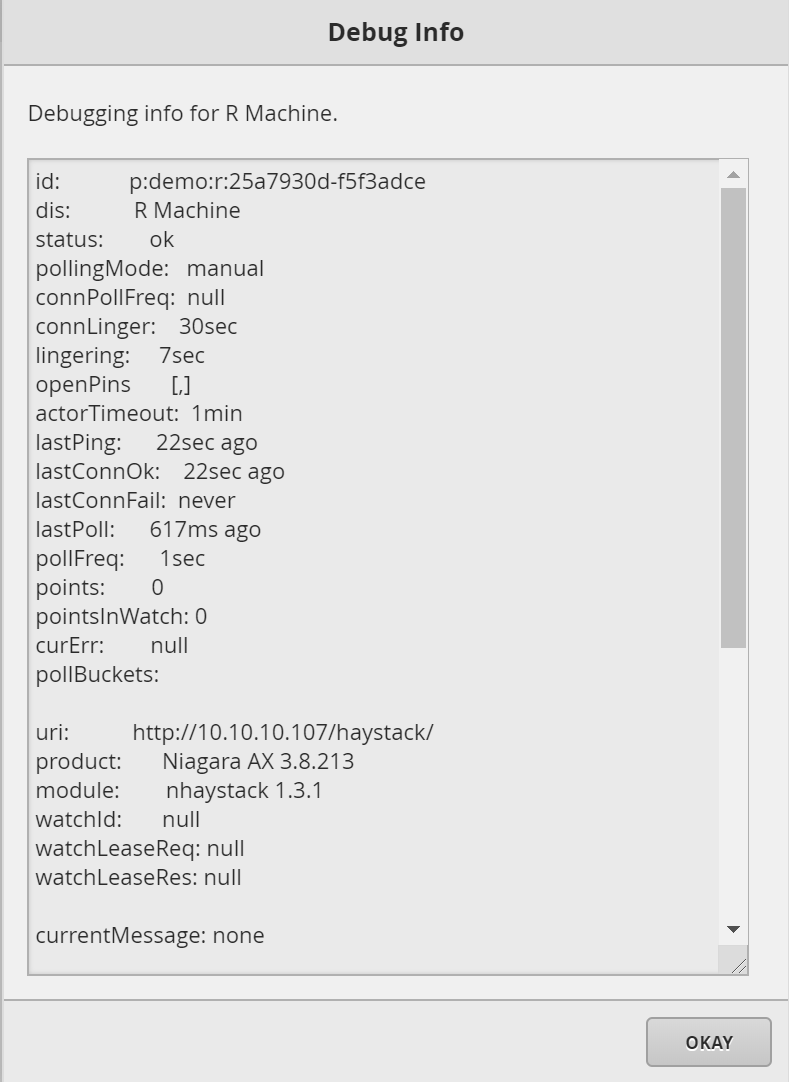 For Haystack connectors the user can see
|