| Description | Code |
|---|
| Copy to root of new file. How to find what project you are in and how to align | var project = facade.retrieveProxy("ProjectProxy").selectedProject; project.controller.componentSelectionMediator.selectedItems project.controller.componentSelectionMediator.selectedItems[0].x = "10px" |
|
|
| var project = facade.retrieveProxy("ProjectProxy").selectedProject; var items = project.controller.database.queryAll("foo"); project.controller.componentSelectionMediator.selectedItems = items; |
| project.controller.undoManager.changeEvents to find it first add this: var button = project.controller.database.query("elementTagName == \"button\"") |
| var promise = project.controller.createNewComponent("siemens");
promise.then(function (c) { c.x = "100px";}); |
| project.controller.createNewComponent("siemens").then(function(c) { c.x = "100px"; c.y = "100px";}); |
| var label = project.controller.database.query("label");
var poly = project.controller.database.query("svg");
label.x = poly.xInPixels + ((poly.widthInPixels - label.widthInPixels) / 2) + "px";
label.y = poly.yInPixels + ((poly.heightInPixels - label.heightInPixels) / 2) + "px"; |
| This is a boolean operator that will 1st return displayName if it exists, if it doesn't then navName, and so on. This will be an easy way to look for tags if they exist in a certain order. | var pointName = point.displayName || point.navName || point.name || point.dis; |
| Set this in the program to be on change, and then this is the javaScript that will make this work | var in1 = this;
var in2 = query(("in1" in this) ? "in2" : "in1");
var label = query('foo');
label.value = parseInt(in1.value) + parseInt(in2.value); |
| /////// Mouse Out
var widgets = queryAll('foo');
widgets.forEach(function(item){
item.style.textShadow = "";
});
////// Mouse Over
var widgets = queryAll('foo');
widgets.forEach(function(item){
item.style.textShadow = "0 0 3px #FF0000";
}); |
| Scaling canvas images. | var chiller = query("chiller");
var foo = chiller.view;
foo.style.transform = "scale(.5,.5)"; |
| Example on how to animate numbers | createjs.Tween.get(Label.view, {loop: false}).to({left: 352,top: 181}, 500, createjs.Ease.cubicOut); |
| Not sure if its right. | var siteLabel = query("siteinfo");
var equipLabel = query("equipinfo");
var countValue = "equip";
var promise = finstack.evalAll([sprintf("readAll($1)","site"),
sprintf("readCount($1)", countValue)]);
promise.then(function (event)
{
var site = event.result[0].toObj(false, false, false);
var equipCount = event.result[1].toObj(false, false, true);
siteLabel.value = site.length;
equipLabel.value = equipCount;
},
function (error)
{
// Handle Error
}); |
| Find every finModel superman and set the width to 145px. (just replace id) | var project = facade.retrieveProxy("ProjectProxy").selectedProject;
var widgets = project.controller.database.queryAll("fileRef==\"1e60b5a8-4141a02b\"");
widgets.forEach(function(item){
item.width = "145px";
}); |
| Calculate the size of superman components and automatically set them to whatever | var project = facade.retrieveProxy("ProjectProxy").selectedProject;
var widgets = project.controller.database.queryAll("fileRef==\"1e60b5a8-4141a02b\"");
widgets.forEach(function(item){
var myName = item.name.split("_")[0];
var count = myName.length;
item.width = ((count * 3) + 130) + "px";
}); |
| var widgets = queryAll("foo");
widgets.forEach(function(item){
///var myName = item.name.split("_")[0];
var labelX = parseInt(item.x); ///parseFloat would work too if it was 50.33
item.x = (labelX + 50) +"px";
}); |
| How to find, add, or remove classes | foo.view.classList.contains("className");
foo.view.classList.add("className");
foo.view.classList.remove("className"); |
| This puts a marker on all the sites in the US Map. It grabs it from the weather data. You have to make sure you create a virtualPoint and add the query tag with the readAll(weather) tag. This one will also let you click on the marker, and open something. The example of this shows an alert window, but anything could go there. | var myChart = query('foo')
var myData = query('virtualPoint and query');
var points = myData.curVal.toObj();
// var cords = [{lat:-25.363, lon:131.044, title:'Suck it'},{lat:-27.367, lon:131.044, title:'Shally it'}];
var start = points[0].geoCoord.split(","); function initMap() {
var myLatLng = {lat: 37.1958341, lng: -123.7629404};
var map = new google.maps.Map(myChart.view, {
zoom: 6,
center : {lat:parseFloat(start[0]), lng:parseFloat(start[1])}
});
points.forEach(function(cd) {
var pair = cd.geoCoord.split(",");
var m = new google.maps.Marker({
position: {lat:parseFloat(pair[0]), lng:parseFloat(pair[1])},
map: map,
title: cd.dis
});
m.addListener('click', function() {
map.setZoom(14);
alert("I just clicked on " + cd.dis);
map.setCenter(m.getPosition());
});
});
} initMap(); |
| This adds the name of all the sites and the chart displays the area for each site. You have to make sure you create a virtualPoint with the query data as well. | var myPoint = query('virtualPoint and query');
var myChart = query('foo');
var chart = AmCharts.makeChart( myChart.view, {
"type": "serial",
"theme": "light",
"dataProvider": myPoint.curVal.toObj(),
"valueAxes": [ {
"gridColor": "#FFFFFF",
"gridAlpha": 0.2,
"dashLength": 0
} ],
"gridAboveGraphs": true,
"startDuration": 1,
"graphs": [ {
"balloonText": "[[category]]: <b>[[value]]</b>",
"fillAlphas": 0.8,
"lineAlpha": 0.2,
"type": "column",
"valueField": "area"
} ],
"chartCursor": {
"categoryBalloonEnabled": false,
"cursorAlpha": 0,
"zoomable": false
},
"categoryField": "dis",
"categoryAxis": {
"gridPosition": "start",
"gridAlpha": 0,
"tickPosition": "start",
"tickLength": 20
},
"export": {
"enabled": true
} } ); |
Show all sites Area in a bar chart side ways. 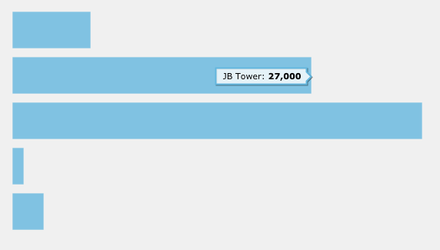
| ///// myData is a virtualPoint that has a query readAll(site) ///// myCHart is a chart that has the foo tag var myChart = query('foo');
var myData = query('virtualPoint and query'); var chart = AmCharts.makeChart( myChart.view, {
"type": "serial",
"rotate":true,
"theme": "light",
"dataProvider": myData.curVal.toObj(),
"valueAxes": [ {
"gridColor": "#FFFFFF",
"gridAlpha": 0,
"dashLength": 0,
"labelsEnabled":false,
"axisAlpha":0
} ],
"gridAboveGraphs": true,
"startDuration": 1,
"graphs": [ {
"balloonText": "[[category]]: <b>[[value]]</b>",
"fillAlphas": 0.8,
"lineAlpha": 0.2,
"type": "column",
"valueField": "area"
} ],
"chartCursor": {
"categoryBalloonEnabled": false,
"cursorAlpha": 0,
"zoomable": false
},
"categoryField": "dis",
"categoryAxis": {
"labelsEnabled":false,
"gridPosition": "start",
"gridAlpha": 0,
"tickPosition": "start",
"tickLength": 0,
"axisAlpha":0
},
"export": {
"enabled": true
} } ); |
- make a virtualPoint and add the query string with the value of readAll(site)
- add a chart to the world with the foo tag
- Add a button to the world with the code to the right as the click event. All changes are in blue.
Other possible properties to add to it. "rotate":true, (this changes orientation of chart) | var myChart = query('foo');
var myPoint = query('virtualPoint and query'); var chart = AmCharts.makeChart(myChart.view, {
"type": "serial",
"theme": "light",
"dataProvider":myPoint.curVal.toObj() ,
"valueAxes": [ {
"gridColor": "#FFFFFF",
"gridAlpha": 0.2,
"dashLength": 0
} ],
"gridAboveGraphs": true,
"startDuration": 1,
"graphs": [ {
"balloonText": "[[category]]: <b>[[value]]</b>",
"fillAlphas": 0.8,
"lineAlpha": 0.2,
"type": "column",
"valueField": "area"
} ],
"chartCursor": {
"categoryBalloonEnabled": false,
"cursorAlpha": 0,
"zoomable": false
},
"categoryField": "dis",
"categoryAxis": {
"gridPosition": "start",
"gridAlpha": 0,
"tickPosition": "start",
"tickLength": 20
},
"export": {
"enabled": true
} } ); |
| Function to show off status bar | () => do jobId: jobRun([jobSleep(5s), jobProgress(20, ""), jobSleep(5s), jobProgress(40, ""), jobSleep(5s), jobProgress(60, ""), jobSleep(5s), jobProgress(80, ""), jobSleep(5s), jobProgress(99, ""), jobSleep(1s)]) {}.toGrid.addMeta({"showJobProgress": jobId}) end |
| Reversing Valve Program | Add tags to the cooling and heating valves. Query all 3 points and write the if statements below. 
|
| How to call the date picker | top.app.ShowCalendar(null,function(range) {console.log(range)},{periods:true}) |