Dynamic Chart
We have created the below dynamic chart that is an example of what can be done. If you are a developer or have developers, you can use this and do other things with it or improve on it. It has predefined filters, custom day range, date picker, and export. AmChart has their own export feature, but in the current version we don't have all the exact files needed for that to function, so we used an export function found online to use with it.
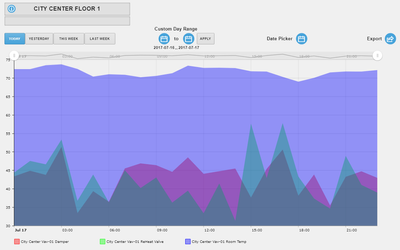
How it works
The user can either select from predefined filters on the buttons or use the custom day range to choose between certain days they would like to filter from. They can also just use the date picker instead of using the other options. In our program, its looking for any point tagged as "foo", which the user can change to include what they want, then it'll display that on the chart. Then depending on what is on the chart, it can then be exported to CSV.
How to get it
The user can download a copy of this graphic below. The graphic runs on "floor" and is called "Dynamic Chart". Once uploaded, if you tag a couple points as "foo", it should then display those when choosing a filter. Or open the graphic and edit the program to change "foo" to what you want to query.

Code involved
Below is the code and items to make this work.
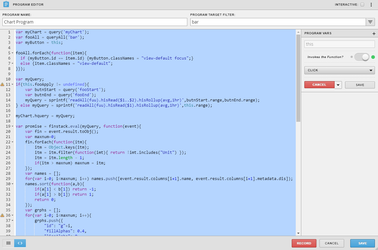
Chart Program
This is the main program for the chart and what is used to render it. This is also where the query is found that returns that data to display on chart. Program runs on "bar", which is found on the predefined filter buttons. The variable is "this" on click. The predefined buttons also have string property tag called range as today, yesterday, thisWeek, or lastWeek respectively.
var myChart = query('myChart');
var fooAll = queryAll('bar');
var myButton = this;

fooAll.forEach(function(item){
  if (myButton.id == item.id) {myButton.classNames = "view-default focus";}
  else {item.classNames = "view-default";
}});

var myQuery;
if(this.fooApply != undefined){
    var butnStart = query('fooStart');
    var butnEnd = query('fooEnd');
    myQuery = sprintf('readAll(foo).hisRead($1..$2).hisRollup(avg,1hr)',butnStart.range,butnEnd.range);
} else myQuery = sprintf('readAll(foo).hisRead($1).hisRollup(avg,1hr)',this.range);

myChart.hquery = myQuery;

var promise = finstack.eval(myQuery, function(event){
    var fin = event.result.toObj();
    var maxnum=0;
    fin.forEach(function(itm){
        itm = Object.keys(itm);
        itm = itm.filter(function(imt){ return !imt.includes("Unit") });
        itm = itm.length - 1;
        if(itm > maxnum) maxnum = itm;
    });
    //this for loop is new, it fixes a bug that some customers have
    for(var i=0; i<maxnum; i++){ //find real maxnum
        if(event.result.columns[i+1] == undefined){
            maxnum = Math.max(0,i-1);
            break;
        }
    }
    var names = [];
    for(var i=0; i<maxnum; i++) names.push([event.result.columns[i+1].name, event.result.columns[i+1].metadata.dis]);
    names.sort(function(a,b){
        if(a[1] < b[1]) return -1;
        if(a[1] > b[1]) return 1;
        return 0;
    });
    var grphs = [];
    for(var i=0; i<maxnum; i++){
        grphs.push({
            "id": "g"+i,
            "fillAlphas": 0.4,
            "lineAlpha": 0,
            "fillColors": ["#ff0000","#00ff00","#0000ff","#d000ff","#ffffa00"][i],
            "valueField": names[i][0],
            "title": names[i][1],
             "balloonText": "<div style='margin:5px; font-size:19px;'><b>[[value]]</b></div>",
        });
    }
    var chart = AmCharts.makeChart(myChart.view, {
        "type": "serial",
        "theme": "light",
        "marginRight": 80,
        "dataProvider": fin,
        "numberFormatter": {precision: 1, decimalSeparator:'.', thousandsSeparator:''},
        "graphs": grphs,
        "legend": {
            // "labelWidth":50,
            // "valueWidth":0,
            // "useGraphSettings": false,
            // "backgroundColor":"#FF0000",
            // "color":"#FF0000",
            "labelText":"[[title]]"
        },
        "chartScrollbar": {
            "graph": "g0",
            "scrollbarHeight": 25,
            "backgroundAlpha": 0,
            "selectedBackgroundAlpha": 0.1,
            "selectedBackgroundColor": "#888888",
            "graphFillAlpha": 0,
            "graphLineAlpha": 0.5,
            "selectedGraphFillAlpha": 0,
            "selectedGraphLineAlpha": 1,
            "autoGridCount": true,
            "color": "#AAAAAA"
        },
        "chartCursor": {
            "categoryBalloonDateFormat": "JJ:NN, DD MMMM",
            "cursorPosition": "mouse"
        },
        "categoryField": "ts",
        "categoryAxis": {
            "minPeriod": "mm",
            "parseDates": true
        },
        "export": {
            "enabled": true,
             "dateFormat": "YYYY-MM-DD HH:NN:SS"
        }
    });
});
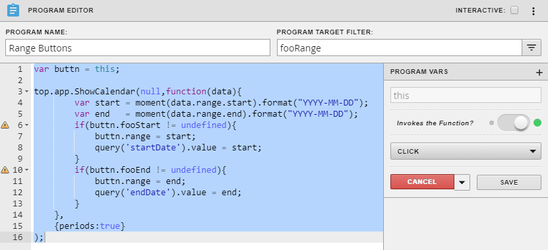
This program is for the calendar component. It returns the correct date format needed for the hisRead axon query. It runs on "fooRange", which is a tag on the calendar icon labels. The variable is "this" on click. The icons also have "fooStart" and "fooEnd" respectively and string propery tag called range as null. The apply button also has bar and fooApply tags.
var buttn = this;

top.app.ShowCalendar(null,function(data){
        var start = moment(data.range.start).format("YYYY-MM-DD");
        var end   = moment(data.range.end).format("YYYY-MM-DD");
        if(buttn.fooStart != undefined){
            buttn.range = start;
            query('startDate').value = start;
        }
        if(buttn.fooEnd != undefined){
            buttn.range = end;
            query('endDate').value = end;
        }
    },
    {periods:true}
);
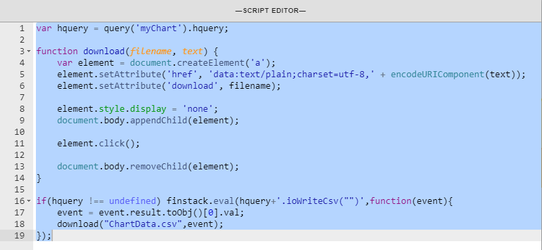
Export (Event onClick)
Below is the code for the event used on the export icon. Select the label icon and right click on it to Create Event > Mouse > Mouse Click. Paste the code below.
var hquery = query('myChart').hquery;

function download(filename, text) {
    var element = document.createElement('a');
    element.setAttribute('href', 'data:text/plain;charset=utf-8,' + encodeURIComponent(text));
    element.setAttribute('download', filename);

    element.style.display = 'none';
    document.body.appendChild(element);

    element.click();

    document.body.removeChild(element);
}

if(hquery !== undefined) finstack.eval(hquery+'.ioWriteCsv("")',function(event){
    event = event.result.toObj()[0].val;
    download("ChartData.csv",event);
});
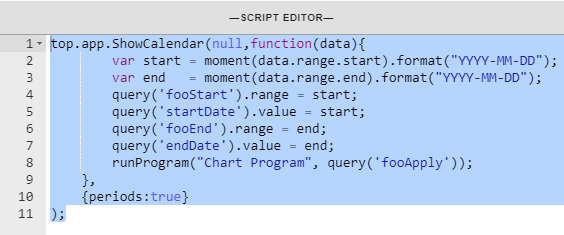
Date Picker (Event onClick)
Below is the code for the date picker icon. Select the label icon and right click on it to Create Event > Mouse > Mouse Click. Paste the code below. A tag to add on the icon is string property tag called "range" with value null.
top.app.ShowCalendar(null,function(data){
        var start = moment(data.range.start).format("YYYY-MM-DD");
        var end   = moment(data.range.end).format("YYYY-MM-DD");
        query('fooStart').range = start;
        query('startDate').value = start;
        query('fooEnd').range = end;
        query('endDate').value = end;
        runProgram("Chart Program", query('fooApply'));
    },
    {periods:true}
);