Room-Clg-Htg Comparison Chart
- Christopher Simonian
- Ricky Villa
Owned by Christopher Simonian
Last updated: May 25, 2017
TABLE OF CONTENTS
Description
This chart setup takes a query that queries Heating Setpoint, Cooling Setpoint and Room Temp for multiple equipment and allows them all to be displayed in visual chart.
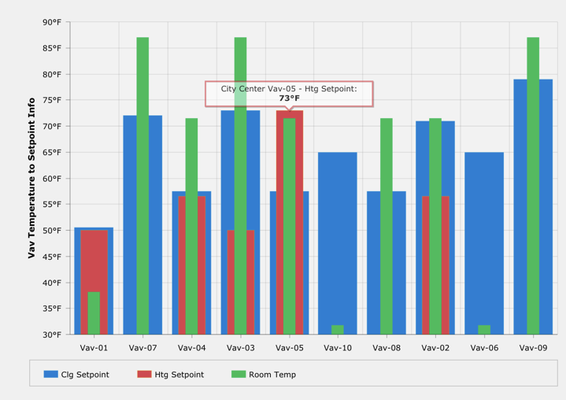
This makes it easy to compare and contrast multiple points from the same equipment in one bar chart.
Completed Model (Basic)
Download:
Video
Example: N/A
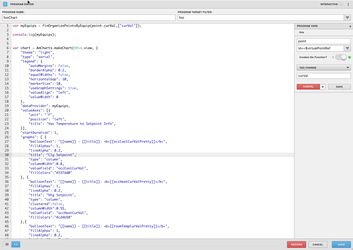
Example Program Code
Program Target: myChart (or any other uniques tag that you decide to put on your chart)
Model Tags: (Tags that go on the chart)
- query: [String] readAll(equipRef->ahuRef==$id and point and (navName=="OccCool" or navName=="OccHeat" or navName=="Room Temp"))
- myChart: [Marker] this could be literally any tag you want as long as its unique. Make sure the program is running on whatever you choose this tag to be.
Variables:
- point:point = id==$virtualPointRef - this allows the program to recognize and use the query (string property tag) as a variable
var myEquips = finOrganizePointsByEquip(point.curVal,["curVal"]);
console.log(myEquips);

var chart = AmCharts.makeChart(this.view, {
"theme": "light",
"type": "serial",
"legend": {
"autoMargins": false,
"borderAlpha": 0.2,
"equalWidths": false,
"horizontalGap": 10,
"markerSize": 10,
"useGraphSettings": true,
"valueAlign": "left",
"valueWidth": 0
},
"dataProvider": myEquips,
"valueAxes": [{
"unit": "°F",
"position": "left",
"title": "Vav Temperature to Setpoint Info",
}],
"startDuration": 1,
"graphs": [ {
"balloonText": "[[name]] - [[title]]: <b>[[occCoolCurValPretty]]</b>",
"fillAlphas": 1,
"lineAlpha": 0.2,
"title": "Clg Setpoint",
"type": "column",
"columnWidth":0.8,
"valueField": "occCoolCurVal",
"fillColors":"#337dd0"
}, {
"balloonText": "[[name]] - [[title]]: <b>[[occHeatCurValPretty]]</b>",
"fillAlphas": 1,
"lineAlpha": 0.2,
"title": "Htg Setpoint",
"type": "column",
"clustered":false,
"columnWidth":0.55,
"valueField": "occHeatCurVal",
"fillColors":"#cd4b50"
},{
"balloonText": "[[name]] - [[title]]: <b>[[roomTempCurValPretty]]</b>",
"fillAlphas": 1,
"lineAlpha": 0.2,
"title": "Room Temp",
"type": "column",
"clustered":false,
"columnWidth":.25,
"valueField": "roomTempCurVal",
"fillColors":"#33ba60"
}],
"plotAreaFillAlphas": 0.1,
"categoryField": "equipName",
"categoryAxis": {
"gridPosition": "start"
},
"export": {
"enabled": true
}
});
How To Make your Own
- bring out a chart, add a unique marker tag (ex: myChart)
- add another string property tag to it and call the tag `query`
- the value of the query string tag should be catered to what your trying to show on the chart in the following format. Below is just an example of the format (Tip* you can change the ahuRef to be floorRef):
- readAll(equipRef->ahuRef==$id and point and (navName=="OccCool" or navName=="OccHeat" or navName=="Room Temp"))
- Create a new program
- set the program to run on the unique tag you added in step one (Ex: myChart)
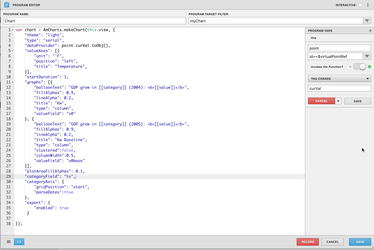
- add a new variable called point and have the query be "id==$virtualPointRef" that is invoked by the curVal "tag change" function. Refer to screenshot below:
- paste in the main program code listed in the begging of this doc and save the program.
- Save and view. Your done!
, multiple selections available,