History Comparison Chart
- Christopher Simonian
- Ricky Villa
Owned by Christopher Simonian
Last updated: Jan 24, 2018 by Ricky Villa
Description
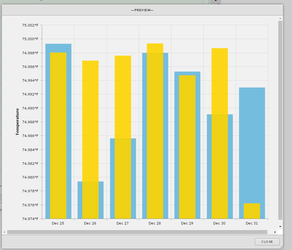
This chart allows your to compare current point data with the previously trended history data of the same point.
The query example utilizes a baseline function that grabs previous history data from the point that is selected from a specific period of time that is adjustable by the user.
Completed Model (Basic)
Download: ComparisonChartExample.zip
Video
Example:
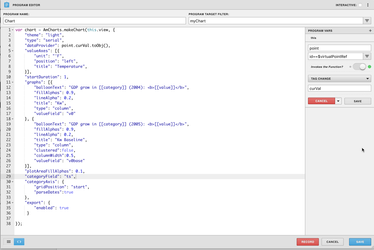
Example Program Code
Program Target: myChart (or any other uniques tag that you decide to put on your chart)
Model Tags:
- query: this is a string tag that will contain the query. The query should use this formatting: read(zone and temp and sensor).finHisReadBaseline(thisWeek(),lastWeek(),{fold1:max,interval1:1day},null, true)[0]
- myChart: this is a marker tag that could be literally anything you want. Make sure the program is running on whatever you choose this tag to be.
Variables:
- point:point = id==$virtualPointRef - this allows the program to recognize and use the query (string property tag) as a variable
var chart = AmCharts.makeChart(this.view, {
"theme": "light",
"type": "serial",
"dataProvider": point.curVal.toObj(),
"valueAxes": [{
"unit": "°F",
"position": "left",
"title": "Temperature",
}],
"startDuration": 1,
"graphs": [{
"balloonText": "GDP grow in [[category]] (2004): <b>[[value]]</b>",
"fillAlphas": 0.9,
"lineAlpha": 0.2,
"title": "Kw",
"type": "column",
"valueField": "v0"
}, {
"balloonText": "GDP grow in [[category]] (2005): <b>[[value]]</b>",
"fillAlphas": 0.9,
"lineAlpha": 0.2,
"title": "Kw Baseline",
"type": "column",
"clustered":false,
"columnWidth":0.5,
"valueField": "v0base"
}],
"plotAreaFillAlphas": 0.1,
"categoryField": "ts",
"categoryAxis": {
"gridPosition": "start",
"parseDates":true
},
"export": {
"enabled": true
}
});
How To Make your Own
- bring out a chart, add a unique marker tag (ex: myChart)
- add another string proeprty tag to it and call the tag `query`
- the value of the query string tag should be catered to what your trying to show on the chart in the following format:
- read(zone and temp and sensor).finHisReadBaseline(thisWeek(),lastWeek(),{fold1:max,interval1:1day},null, true)[0]
- Create a new program
- set the program to run on the unique tag you added in step one (myChart)
- add a new variable called point and have the query be "id==$virtualPointRef" that is invoked by the curVal "tag change" function. Refer to screenshot below:
- paste in the main program code listed in the begging of this doc and save the program.
- Save and view. Your done!
- You can also add buttons to change the query string tag to show different comparisons that the end user can dynamically trigger.
Code for 3D Chart Comparison Version
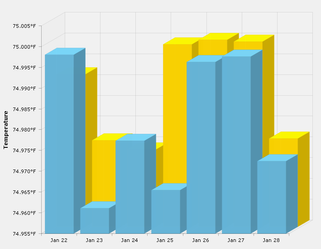
3D Chart
var chart = AmCharts.makeChart(this.view, {
    "theme": "light",
    "type": "serial",
    "dataProvider": point.curVal.toObj(),
    "valueAxes": [{
        "stackType": "3d",
        "unit": "°F",
        "position": "left",
        "title": "Temperature",
    }],
    "startDuration": 1,
    "graphs": [{
        "balloonText": "GDP grow in [[category]] (2004): <b>[[value]]</b>",
        "fillAlphas": 0.9,
        "lineAlpha": 0.2,
        "title": "2004",
        "type": "column",
        "valueField": "v0"
    }, {
        "balloonText": "GDP grow in [[category]] (2005): <b>[[value]]</b>",
        "fillAlphas": 0.9,
        "lineAlpha": 0.2,
        "title": "2005",
        "type": "column",
        "valueField": "v0base"
    }],
    "plotAreaFillAlphas": 0.1,
    "depth3D": 60,
    "angle": 30,
    "categoryField": "ts",
    "categoryAxis": {
		"parseDates":true
    },
    "export": {
    	"enabled": true
     }
});
jQuery('.chart-input').off().on('input change',function() {
	var property	= jQuery(this).data('property');
	var target		= chart;
	chart.startDuration = 0;

	if ( property == 'topRadius') {
		target = chart.graphs[0];
      	if ( this.value == 0 ) {
          this.value = undefined;
      	}
	}

	target[property] = this.value;
	chart.validateNow();
});
Here is extra code that can be useful for charts.
//here is a link for some amCharts docs: https://docs.amcharts.com/javascriptcharts/AmChart

//for rotate the axis, use the below as true or false
"rotate":false,

//for legend, you'll need the below code. this is for when you have multiple results being returned
 "legend": {
        "useGraphSettings": true,
        "markerSize":12,
        "valueWidth":0,
        "verticalGap":0
    }

//for the graphs, below are example properties
"graphs": [{
        "id": "g1",
        "fillAlphas": 0.4, //fill alpha
        "lineAlpha": 0, //line alpha (also affects the legend, make it 0 so that its based on the "fillColors" below else. you need to set it with "legendColor")
        "fillColors": "#FF0000", //fill color of the graph
        "legendColor": "#FF00FF", //color of the legends
        "valueField": "v0",
        "title":"RAT 1", //to identify each legend
         "balloonText": "<div style='margin:5px; font-size:19px;'><b>[[value]]</b></div>",
    }

//for precision, include either line below in the code
"precision": 1
"numberFormatter": {precision: 1, decimalSeparator:'.', thousandsSeparator:''}


//for formatting the dates, include the below and configure how you would like it. "minPeriod" updates the bar time frame on the chart.
       "categoryAxis": {
		"parseDates":true,
		"equalSpacing": true,
		"minPeriod": "hh",
		"gridPosition": "start",
    		"dateFormats":[
               {
                  "period":"fff",
                  "format":"L:NN:SS A"
               },
               {
                  "period":"ss",
                  "format":"L:NN:SS A"
               },
               {
                  "period":"mm",
                  "format":"L:NN A"
               },
               {
                  "period":"hh",
                  "format":"L:NN A"
               },
               {
                  "period":"DD",
                  "format":"MMM DD"
               },
               {
                  "period":"WW",
                  "format":"MMM DD"
               },
               {
                  "period":"MM",
                  "format":"MMM"
               },
               {
                  "period":"YYYY",
                  "format":"YYYY"
               }]
    }
, multiple selections available,