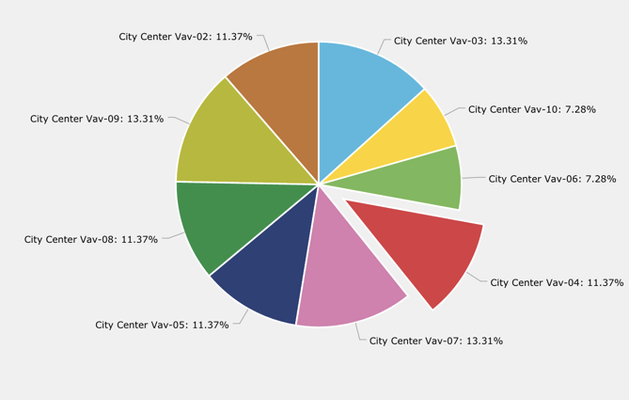
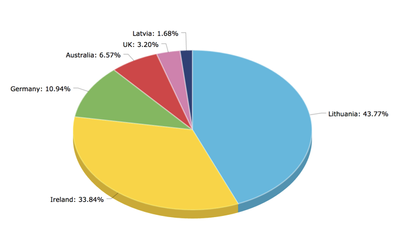
Pie Chart with Relative Bubbles
- Christopher Simonian
- Ricky Villa
Table of Contents
Description
This Pie Chart can be customized to show data based on any axon query defined by the integrator.
This also allows for the user to click on any slice and call open the relative bubbles.
Completed Model (Basic)
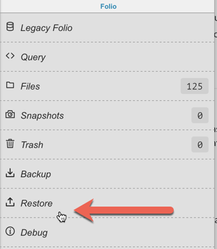
Download: PieChart_DynamicExample.zip
- To upload go to Folio app and select "restore".
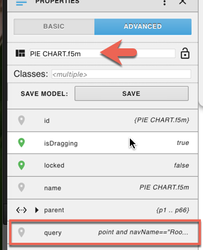
- For pie chart to populate you need to add a 'query' string tag to the model and plug in your axon query as the value.
Video Tutorial
Example: VIDEO
Model Tags (Group)
myPieChart (marker) - this allows the program to recognize what its running on
query (string) - this string tag will be your query. Ex: readAll(damper and point and floorRef==$id) or Ex: readAll(navName=="Room Temp" and point and floorRef==$id)
*Note: If you want to just use the amChart and not include any other components, then apply the above tags to the amChart itself. If you decide afterwards to add labels or other compoents, then you'll need to group them together. Then remove the tags on the amChart and apply to the group instead.
Example Program Code
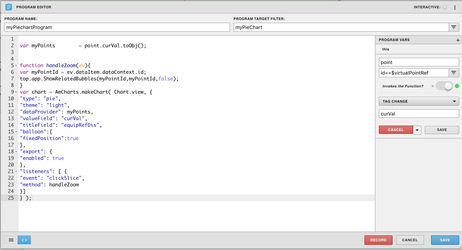
Program Target: myPieChart
Program Variables:
- point: point = id==$virtualPointRef - this allows the program to recognize and use the query (string property tag) as a variable
- myPoints: myPoints = point.curVal.toObj() - this grab the query and brings in the query as separate values for the program to use individually within the chart
var myPoints = point.curVal.toObj();

function handleZoom(ev){
var myPointId = ev.dataItem.dataContext.id;
top.app.ShowRelatedBubbles(myPointId,myPointId,false);
}
var chart = AmCharts.makeChart( Chart.view, {
"type": "pie",
"theme": "light",
"dataProvider": myPoints,
"valueField": "curVal",
"titleField": "equipRefDis",
"balloon":{
"fixedPosition":true
},
"export": {
"enabled": true
},
"listeners": [ {
"event": "clickSlice",
"method": handleZoom
}]
} );
- in the program, the line that says the following: "var chart = AmCharts.makeChart( Chart.view, { " please note that the "Chart.view" is based on whatever the name of your chart is. So if you renamed yoru original amChart, please make sure to update that in the code. .
How To Make your Own
- bring out an amChart & and extra component (extra component will be for step 3 only..any component is fine)
- Select chart & extra component
- Right click and select "create group" so a group is made with the amChart & the extra component
- Go to your layers panel and delete the etxra component
- on the group add a myPieChart tag (this is an arbitrary tag, you may change this to be whatever you'd like)
- create a new program
- have the program run on myPieChart (or whatever unique tag you added to the model group)
- create a variable on the variable menu that is called "point" and query for ' id==$virtualPointRef ', have it be invoked by a "Tag Change" function which should be 'curVal'
- copy the code above
- Select group, go to basic properties panel & change the Width & Height from 'px' to '%' percent and make it 100% on both the group, and the chart component. (use the layers panel to select the am chart within the group)
- You can test your pie chart model's code by adding a 'query' string tag and plugging in your axon query as the value. Go to preview to ensure it works. Delete query tag before saving it as a model
- save your model
- Now every time you bring out your pie chart model you can simply add a "query" string tag and fill out the value with your axon query which will then populate the data onto the pie chart.
*Note: If followed exact steps above and not working, then you might have an older version that requires a hidden am gauge and to be included in the group.
*Note: If followed exact steps above and not working, then you may have an issue with your axon query or your set up may be wrong. Contact support@j2inn.com if you need help troubleshooting your chart.
Try This!
3D Pie Chart
Add the following code to your program to make the chart 3d!
 "depth3D": 15,
 "angle": 30,