Ractive Dashboard
- Sarah Padilla (Unlicensed)
Description
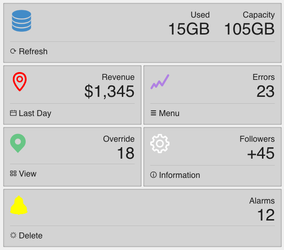
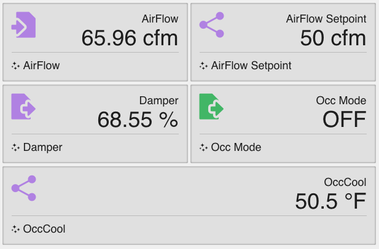
This model acts as a dashboard, displaying however many points are queried. The icon and color are based off the points kind and function, and a url for an image can also be inserted instead of an icon. The bottom section pulls up the magic bubbles and the top right of each box displays the name and value. Each box can display either one or two names and values. The model also has a timer set on it to automatically update the value of each point.
Completed Model (Basic)
Download: ractiveDashboard.zip
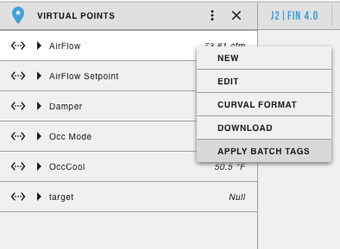
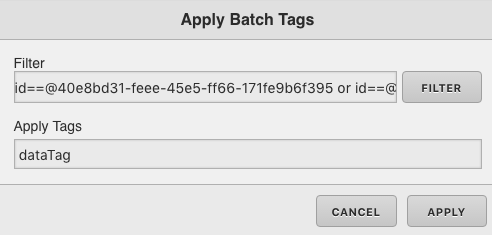
If downloading the model, tags still need to be added to select which points are displayed. To do this, go to the left menu and go to virtual points. Right click and hold down over the virtual points and select "Apply Batch Tags". Select which points you would like to appear in you dashboard component and select apply. Next under Apply Tags type dataTag and click Apply.
Video
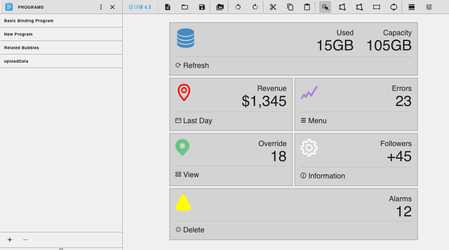
Example:
Ractive Code
Template
<div class="s-container">
{{#points}}
<div class="view-container s-eachBox" style="background:{{backgroundColor}};">
{{#if mainIconImage}}
<img src="{{mainIconImage}}" alt="{{mainIcon}}" style="height:50px;">
{{else}}
<label class="{{mainIcon}}" style="color: {{iconColor}}; font-size: 3em;"></label>{{/if}}
<label class="s-labelTop s-size" align="right">{{mainText}}<br>
<span class="s-labelTop" style="font-size: 2em;" >{{mainValue}}</span>
</label>{{#if mainText2 && mainValue2}}
<label class="s-labelTop s-padding s-size" align="right">{{mainText2}}<br>
<span style="font-size: 2em;" >{{mainValue2}}</span>
</label>{{/if}}
<div>
<br>
<div class="s-line"></div>
<div class="s-hand {{btIcon}} s-icon" on-click="magicB">
<label class="s-hand s-size" on-click="magicB"> {{btIconText}}</label>
</div>
</div>
</div><p> </p>
{{/points}}
</div>
This code sets up each box.
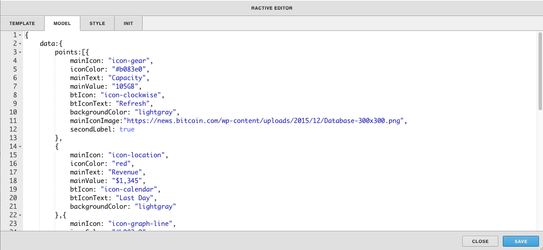
Model
{
    data:{
        points:[{
            mainIcon: "icon-gear",
            iconColor: "#b083e0",
            mainText: "Capacity",
            mainValue: "105GB",
            btIcon: "icon-clockwise",
            btIconText: "Refresh",
            backgroundColor: "lightgray",
            mainIconImage:"https://news.bitcoin.com/wp-content/uploads/2015/12/Database-300x300.png",
            mainText2: "Used",
            mainValue2: "15GB"
        },
        {
            mainIcon: "icon-location",
            iconColor: "red",
            mainText: "Revenue",
            mainValue: "$1,345",
            btIcon: "icon-calendar",
            btIconText: "Last Day",
            backgroundColor: "lightgray"
        },{
            mainIcon: "icon-graph-line",
            iconColor: "#b083e0",
            mainText: "Errors",
            mainValue: "23",
            btIcon: "icon-menu",
            btIconText: "Menu",
            backgroundColor: "lightgray"
        },
        {
            mainIcon: "sm-point",
            iconColor: "#6cc487",
            mainText: "Override",
            mainValue: "18",
            btIcon: "icon-view-thumb",
            btIconText: "View",
            backgroundColor: "lightgray"
        },{
            mainIcon: "icon-gear",
            iconColor: "white",
            mainText: "Followers",
            mainValue: "+45",
            btIcon: "icon-information",
            btIconText: "Information",
            backgroundColor: "lightgray"
        },
        {
            mainIcon: "sm-alarm",
            iconColor: "yellow",
            mainText: "Alarms",
            mainValue: "12",
            btIcon: "icon-loading",
            btIconText: "Delete",
            backgroundColor: "lightgray"
        }]
    }
}
This sets up the data to go in the boxes and assigns sample data to display until the program is run.
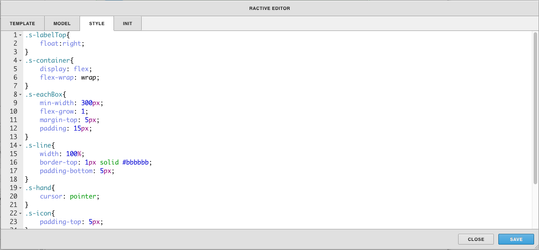
Style
.s-labelTop{
    float:right;
}
.s-container{
    display: flex;
    flex-wrap: wrap;
}
.s-eachBox{
    min-width: 300px;
    flex-grow: 1;
    margin-top: 5px;
    padding: 15px;
}
.s-line{
    width: 100%;
    border-top: 1px solid #bbbbbb;
    padding-bottom: 5px;
}
.s-hand{
    cursor: pointer;
}
.s-icon{
    padding-top: 5px;
}
.s-padding{
    padding-right: 30px;
}
.s-size{
    font-size: 18px;
}
This sets up the style for the boxes
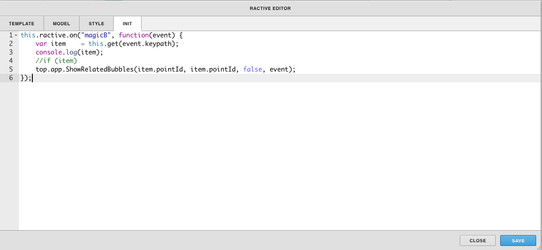
INIT
this.ractive.on("magicB", function(event) {
    var item    = this.get(event.keypath);
    console.log(item);
    if (item)
    top.app.ShowRelatedBubbles(item.pointId, item.pointId, false, event);
});
This is what calls the magic bubbles to appear
Program
var points = queryAll('dataTag');
var myRactive = query('stackRactive');

points.forEach(function(data){
    data.mainValue      = GetPrettyValue(data);
    data.mainText       = data.navName;
    if ("sensor" in data){
        data.mainIcon = "sm-sensor";
        data.btIcon = "wi-stars";
        data.btIconText = data.navName;
    }
    else if ("cmd" in data){
        data.mainIcon ="sm-command";
        data.btIcon = "wi-stars";
        data.btIconText = data.navName;
    }
    else if ("sp" in data){
        data.mainIcon = "sm-softpoint";
        data.btIcon = "wi-stars";
        data.btIconText = data.navName;
    }
    else {
        data.mainIcon = "sm-point";
        data.btIcon = "wi-stars";
        data.btIconText = data.navName;
    }
switch (data.kind) {
    case "Number":
        data.iconColor = "#b083e0";
        break;
    case "Bool":
        data.iconColor = "#48b569";
        break;
    default:
        data.iconColor = "black";
}
});
myRactive.points = points;
This is what gets the data.
How To Make your Own
- Go to virtual points and right click to add batch tags
- Apply a tag on all the virtual points you want displayed called dataTag
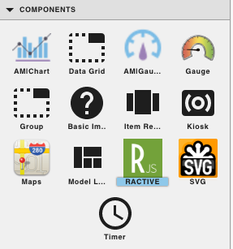
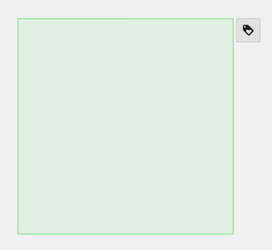
- Bring Ractive out from components on the left side menu, and click on it to have the green outline
- Resize it to the desired length and width
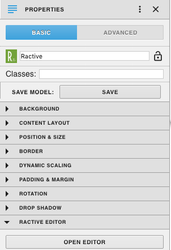
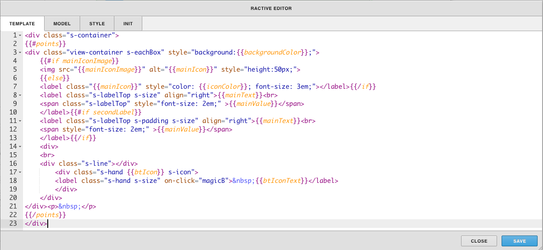
- Under properties open the ractive editor, and copy and paste from the Ractive Code given above for template, model, style, and init
- After copying and pasting, should look like the screenshots below (the full code can be found above)
- After saving go to programs and add a new program
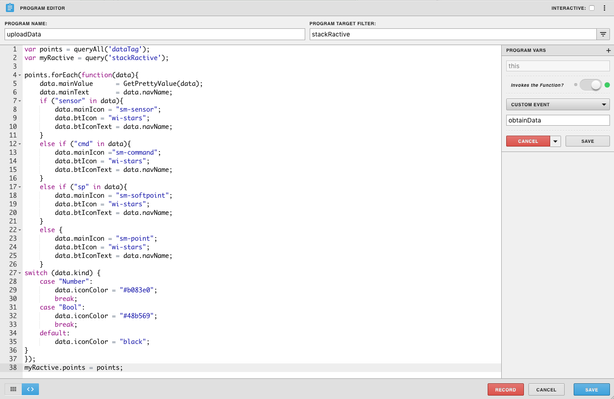
- Name your program, and set the program target filter to stackRactive
- Top right of program editor, click the three dots, and select variables
- Click the gear that appears as you hover over this
- turn Invokes the Function on and change the dropdown to Custom Event
- Type in obtainData in the line below and save
- Copy and paste the above code for program into the main part and save
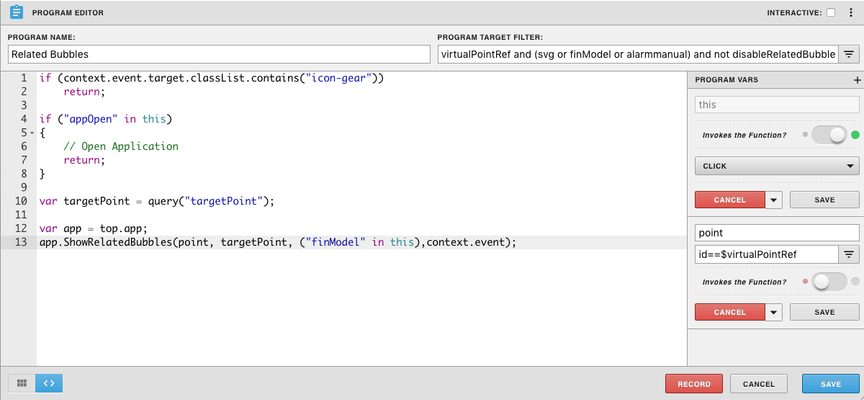
- If your program does not already have Related Bubbles add a new program and copy and paste the code below into your program editor.
- Name your program Related Bubbles and set the Program Target Filter to virtualPointRef and (svg or finModel or alarmmanual) and not disableRelatedBubblesProgram
- Next click the three dots in the upper right hand corner and select variables
- Click the gear on this and turn on Invokes the function, select mouse events and click
- Click the + to add a new variable and click the gear to edit it
- Call the variable point and under the name add id==$virtualPointRef and click the gray save
Related Bubbles
if (context.event.target.classList.contains("icon-gear")) return; if ("appOpen" in this) { // Open Application return; } var targetPoint = query("targetPoint"); var app = top.app; app.ShowRelatedBubbles(point, targetPoint, ("finModel" in this),context.event); - Save and you're done!