Dynamic Bar Chart
- Sarah Padilla (Unlicensed)

From the model...
textOrientationTop: true,
        showMinMax:true
From the model...
textOrientationTop: true,
        showMinMax: false
From the model...
textOrientationTop: false,
        showMinMax:true
From the model...
textOrientationTop: false,
        showMinMax: false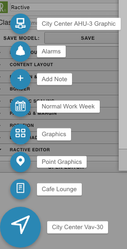
Description
This model has 4 different designs that can be changed in the model portion of the code. Min and Max values can be turned on or off in the Model section of the code. Also in the Model section, it can be specified weather the equip name will be displayed above or next to the bar. It will adjust size and display a scroll bar if there is overflow data. The icon next to the equip name will bring up magic bubbles.
Completed Model (Basic)
Download: Dynamic Bar Chart.zip
To make the model work, the tag barData must be added to a virtual point query.
To do this...
- Click on "Virtual Points" in the right menu
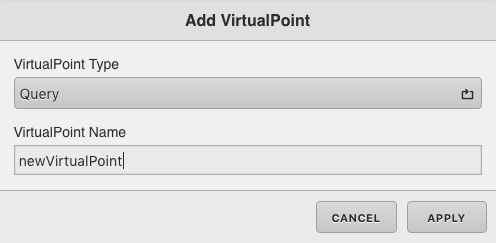
- Next select "+ New Virtual Point"
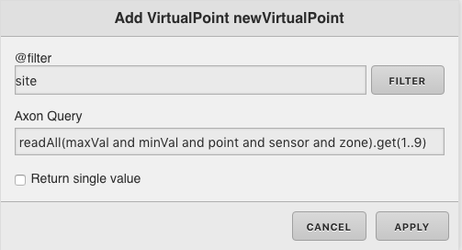
- Change Virtual Point Type to Query (It is probably set to number by default, click on it to select query)
- Name your virtual point whatever you would like, in this example we named it newVirtualPoint
- Under Axon Query put what you would like the component to query. (In this example we used readAll(maxVal and minVal and point and sensor and zone).get(1..9) )
- Select Apply
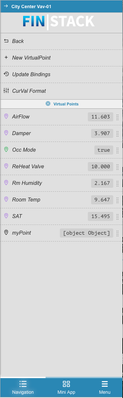
- Then go to Virtual Points in the Left Menu
- Right click and hold down over the virtual points and select "Apply Batch Tags".
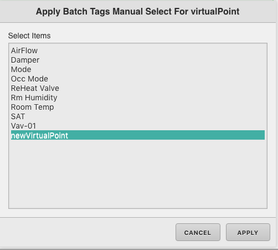
- Select the new point you just added (in our case newVirtualPoint)
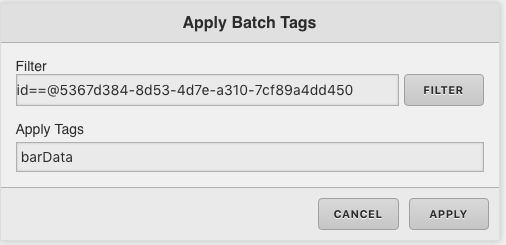
- Next under Apply Tags type barData and click Apply.
Video
Example:
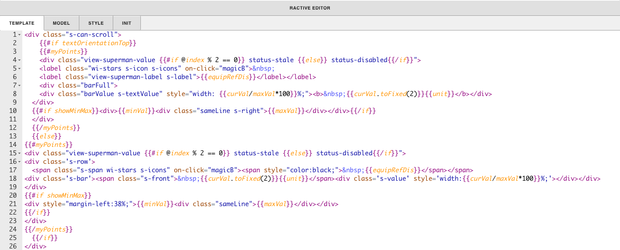
Ractive Code
Template
<div class="s-can-scroll">
{{#if textOrientationTop}}
{{#myPoints}}
<div class="view-superman-value {{#if @index % 2 == 0}} status-stale {{else}} status-disabled{{/if}}">
<label class="wi-stars s-icon s-icons" on-click="magicB">
<label class="view-superman-label s-label">{{equipRefDis}}</label></label>
<div class="barFull">
<div class="barValue s-textValue" style="width: {{curVal/maxVal*100}}%;"><b> {{curVal.toFixed(2)}}{{unit}}</b></div>
</div>
{{#if showMinMax}}<div>{{minVal}}<div class="sameLine s-right">{{maxVal}}</div></div>{{/if}}
</div>
{{/myPoints}}
{{else}}
{{#myPoints}}
<div class="view-superman-value {{#if @index % 2 == 0}} status-stale {{else}} status-disabled{{/if}}">
<div class='s-row'>
<span class="s-span wi-stars s-icons" on-click="magicB"><span style="color:black;"> {{equipRefDis}}</span></span> <div class='s-bar'><span class="s-front"> {{curVal.toFixed(2)}}{{unit}}</span><div class='s-value' style='width:{{curVal/maxVal*100}}%;'></div></div>
</div>
{{#if showMinMax}}
<div style="margin-left:38%;">{{minVal}}<div class="sameLine">{{maxVal}}</div></div>
{{/if}}
</div>
{{/myPoints}}
{{/if}}
</div>
This sets up the table
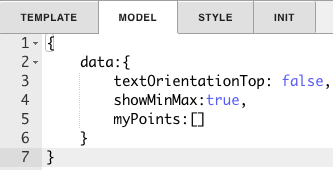
Model
{
    data:{
        textOrientationTop: false,
        showMinMax:true,
        myPoints:[]
    }
}
This sets up the data and items for the query. textOrientationTop: false puts the text to the left of the bar, where textOrientationTop: true would put it on top.
showMinMax: true shoes the min and max values under the bar, but setting it to showMinMax: false would get rid of it.
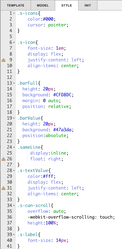
Style
.s-icons{
    color:#000;
    cursor: pointer;
}

.s-icon{
    font-size: 1em;
    display: flex;
    justify-content: left;
    align-items: center;
}

.barFull{
  height: 20px;
  background: #CFD8DC;
  margin: 0 auto;
  position: relative;
}
.barValue{
  height: 20px;
  background: #47a3da;
  position:absolute;
}
.sameLine{
     display:inline;
     float: right;
}
.s-textValue{
    color:#fff;
    display: flex;
    justify-content: left;
    align-items: center;
}
.s-can-scroll{
    overflow: auto;
    -webkit-overflow-scrolling: touch;
    height:100%;
}
.s-label{
    font-size: 14px;
}

.s-row {
  position: relative;
  height: 20px;
  display: flex;
  align-items: center;
}
.s-row .s-span {
  flex: 0 0 auto;
    width: 38%;
}
.s-row .s-bar {
   background: #ddd;
   flex: 1 0 auto;
   height: 100%;
   display: flex;
   align-items: center;
  position: relative;
     color: #fff;
}
.s-row .s-bar .s-front {
  z-index: 5;
}
.s-row .s-value {
   position: absolute;
   left: 0;
   top: 0;
   bottom: 0;
  background: #47a3da;
  transition: 0.3s ease;
}
This is the css to style the list. The second line under .s-icons{ is color:#000; This is what sets the color of the icons. #000 sets the icons to black, but by changing it, you can set a new color.
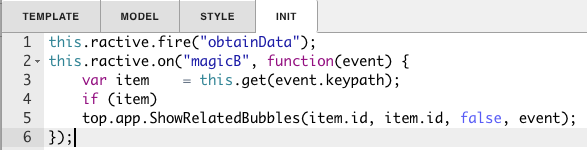
INIT
this.ractive.fire("obtainData");
this.ractive.on("magicB", function(event) {
    var item    = this.get(event.keypath);
    if (item)
    top.app.ShowRelatedBubbles(item.id, item.id, false, event);
});
magicB is for the magic bubbles
Program
var points = query('barData');
this.myPoints = points.curVal.toObj();
This is your program, It sets the ractive component with the data from barData (the tag applied to the virtual point query)
How To Make your Own
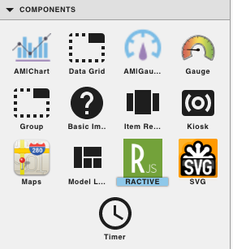
- Bring Ractive out from components on the left side menu, and click on it to have the green outline
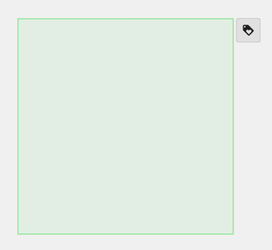
- The green box can be resized to however small or large you would like your component
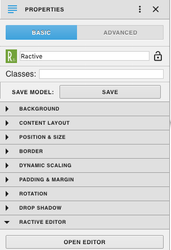
- Under properties open the ractive editor, and copy and paste from the Ractive Code given above for template, model, style, and init
- After copying and pasting, should look like the screenshots below
- After saving go to programs and add a new program
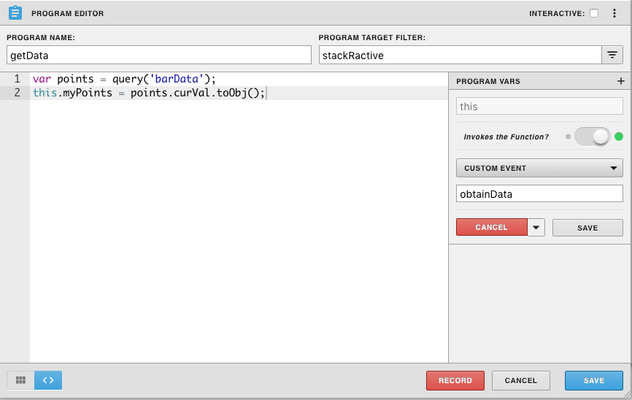
- Name your program (it can be named anything, in this example its called getData), and set the program target filter to stackRavtive
- Top right of program editor, click the three dots, and select variables
- Click the gear that appears as you hover over this
- turn Invokes the Function on and change the dropdown to custom event
- under type obtainData
- Copy and paste the above code for program into the main part and save
- Next add a virtual point:
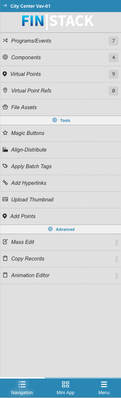
- Click on "Virtual Points" in the right menu
- Next select "+ New Virtual Point"
- Change Virtual Point Type to Query (It is probably set to number by default, click on it to select query)
- Name your virtual point whatever you would like, in this example we named it newVirtualPoint
- Under Axon Query put what you would like the component to query. (In this example we used readAll(maxVal and minVal and point and sensor and zone).get(1..9) )
- Select Apply
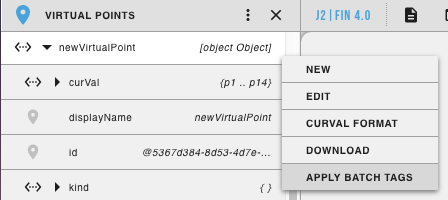
- Then go to Virtual Points in the Left Menu
- Right click and hold down over the virtual points and select "Apply Batch Tags".
- Select the new point you just added (in our case newVirtualPoint)
- Next under Apply Tags type barData and click Apply.
- Save and you're done!